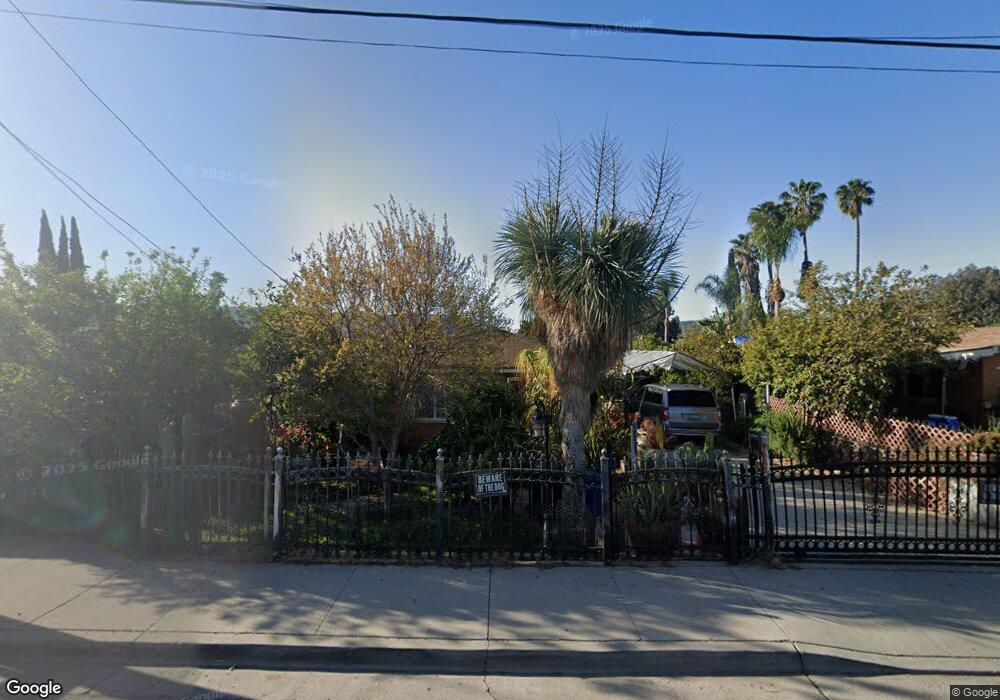
914 4th St Fillmore, CA 93015
Estimated Value: $504,000 - $681,000
4
Beds
1
Bath
1,368
Sq Ft
$444/Sq Ft
Est. Value
About This Home
This home is located at 914 4th St, Fillmore, CA 93015 and is currently estimated at $607,647, approximately $444 per square foot. 914 4th St is a home located in Ventura County with nearby schools including Mountain Vista and Fillmore Senior High.
Ownership History
Date
Name
Owned For
Owner Type
Purchase Details
Closed on
May 15, 1996
Sold by
Pencall Edwin Matthew and Pencall Connie Mcconnell
Bought by
Hernandez Salvador and Hernandez Maria Estela
Current Estimated Value
Purchase Details
Closed on
Nov 8, 1993
Sold by
Gurrola Angelita
Bought by
Hernandez Salvador and Hernandez Maria Estela
Home Financials for this Owner
Home Financials are based on the most recent Mortgage that was taken out on this home.
Original Mortgage
$65,000
Interest Rate
6.88%
Mortgage Type
Seller Take Back
Create a Home Valuation Report for This Property
The Home Valuation Report is an in-depth analysis detailing your home's value as well as a comparison with similar homes in the area
Home Values in the Area
Average Home Value in this Area
Purchase History
| Date | Buyer | Sale Price | Title Company |
|---|---|---|---|
| Hernandez Salvador | -- | -- | |
| Hernandez Salvador | $90,000 | First American Title Ins Co |
Source: Public Records
Mortgage History
| Date | Status | Borrower | Loan Amount |
|---|---|---|---|
| Previous Owner | Hernandez Salvador | $65,000 |
Source: Public Records
Tax History
| Year | Tax Paid | Tax Assessment Tax Assessment Total Assessment is a certain percentage of the fair market value that is determined by local assessors to be the total taxable value of land and additions on the property. | Land | Improvement |
|---|---|---|---|---|
| 2025 | $2,067 | $190,298 | $113,268 | $77,030 |
| 2024 | $2,067 | $186,567 | $111,047 | $75,520 |
| 2023 | $2,038 | $182,909 | $108,869 | $74,040 |
| 2022 | $1,884 | $179,323 | $106,734 | $72,589 |
| 2021 | $2,137 | $175,807 | $104,641 | $71,166 |
| 2020 | $1,983 | $174,007 | $103,569 | $70,438 |
| 2019 | $1,988 | $170,596 | $101,539 | $69,057 |
| 2018 | $1,947 | $167,252 | $99,549 | $67,703 |
| 2017 | $1,957 | $163,974 | $97,598 | $66,376 |
| 2016 | $1,812 | $160,760 | $95,685 | $65,075 |
| 2015 | $1,761 | $158,348 | $94,249 | $64,099 |
| 2014 | $1,759 | $155,248 | $92,403 | $62,845 |
Source: Public Records
Map
Nearby Homes
- 922 Hinckley Ln
- 947 Meadowlark Dr
- 815 Woodgrove Rd
- 809 Woodgrove Rd
- 1129 1st St
- 1120 1st St
- 1112 Mockingbird Ln
- 1143 Los Serenos Dr
- 1000 Foothill Dr
- 222 Village Square
- 553 Grapefruit Ln
- 320 D St
- 404 Central Ave
- 202 Avon Ln
- 300 Fillmore St
- 340 Central Ave
- 503 Arundell Cir
- 639 Mountain View St
- 444 Mountain View St
- 1401 Waterford Ln
Your Personal Tour Guide
Ask me questions while you tour the home.