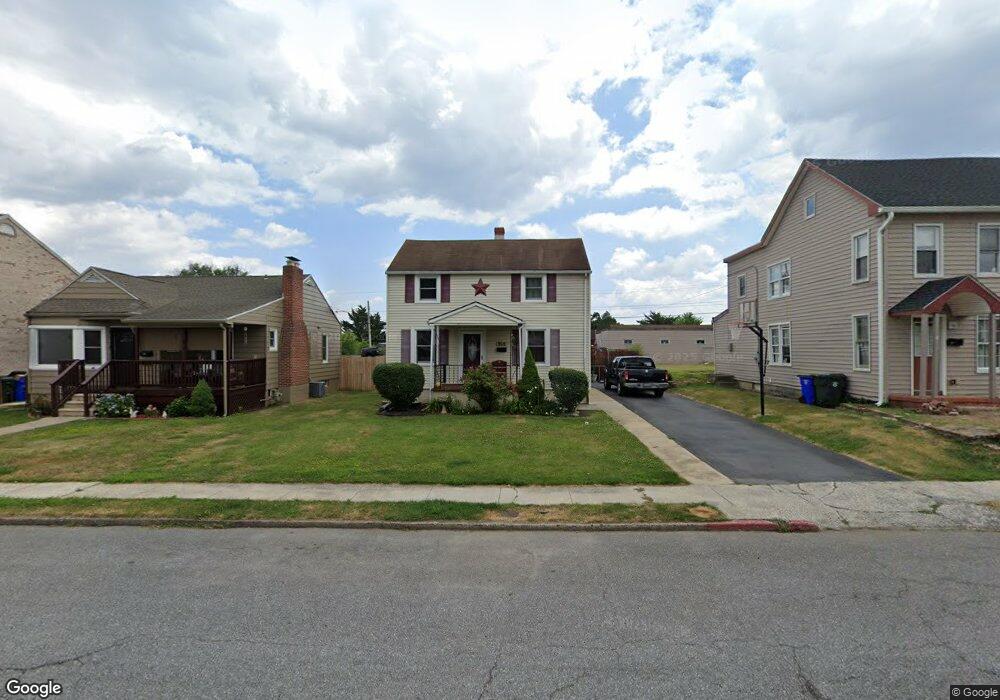
914 Corbett St Hagerstown, MD 21740
South End NeighborhoodEstimated Value: $240,000 - $282,000
4
Beds
2
Baths
1,572
Sq Ft
$161/Sq Ft
Est. Value
About This Home
This home is located at 914 Corbett St, Hagerstown, MD 21740 and is currently estimated at $253,316, approximately $161 per square foot. 914 Corbett St is a home located in Washington County with nearby schools including Emma K. Doub Elementary School, E. Russell Hicks Middle School, and South Hagerstown High School.
Ownership History
Date
Name
Owned For
Owner Type
Purchase Details
Closed on
Dec 15, 2011
Sold by
Heon Louis
Bought by
Wallech Mark O and Buffington Sharie S
Current Estimated Value
Home Financials for this Owner
Home Financials are based on the most recent Mortgage that was taken out on this home.
Original Mortgage
$113,534
Outstanding Balance
$79,104
Interest Rate
4.4%
Mortgage Type
FHA
Estimated Equity
$174,212
Purchase Details
Closed on
Aug 22, 2011
Sold by
Bank Of New York
Bought by
Heon Louis
Purchase Details
Closed on
Aug 15, 2011
Sold by
Us National Association
Bought by
Heon Louis
Purchase Details
Closed on
Jul 8, 2011
Sold by
Mccarron James L and Mccarron Carla A
Bought by
Us Bank National Association
Purchase Details
Closed on
Sep 10, 2010
Sold by
Mccarron James L and Mccarron Carla A
Bought by
Bank Of New York
Purchase Details
Closed on
Jul 31, 2003
Sold by
Bosch William B
Bought by
Mccarron James L and Mccarron Carla A
Create a Home Valuation Report for This Property
The Home Valuation Report is an in-depth analysis detailing your home's value as well as a comparison with similar homes in the area
Home Values in the Area
Average Home Value in this Area
Purchase History
| Date | Buyer | Sale Price | Title Company |
|---|---|---|---|
| Wallech Mark O | $124,900 | None Available | |
| Heon Louis | -- | -- | |
| Heon Louis | $62,500 | None Available | |
| Heon Louis | -- | -- | |
| Us Bank National Association | $67,500 | None Available | |
| Bank Of New York | $67,500 | -- | |
| Mccarron James L | $123,000 | -- |
Source: Public Records
Mortgage History
| Date | Status | Borrower | Loan Amount |
|---|---|---|---|
| Open | Wallech Mark O | $113,534 | |
| Closed | Mccarron James L | -- |
Source: Public Records
Tax History Compared to Growth
Tax History
| Year | Tax Paid | Tax Assessment Tax Assessment Total Assessment is a certain percentage of the fair market value that is determined by local assessors to be the total taxable value of land and additions on the property. | Land | Improvement |
|---|---|---|---|---|
| 2025 | $1,455 | $176,000 | $41,200 | $134,800 |
| 2024 | $1,455 | $159,667 | $0 | $0 |
| 2023 | $1,306 | $143,333 | $0 | $0 |
| 2022 | $1,157 | $127,000 | $41,200 | $85,800 |
| 2021 | $1,125 | $123,900 | $0 | $0 |
| 2020 | $1,125 | $120,800 | $0 | $0 |
| 2019 | $1,100 | $117,700 | $41,200 | $76,500 |
| 2018 | $1,100 | $117,700 | $41,200 | $76,500 |
| 2017 | $1,100 | $117,700 | $0 | $0 |
| 2016 | -- | $117,800 | $0 | $0 |
| 2015 | -- | $117,800 | $0 | $0 |
| 2014 | $2,908 | $117,800 | $0 | $0 |
Source: Public Records
Map
Nearby Homes
- 906 Pope Ave
- 920 Pope Ave
- 831 Rose Hill Ave
- 247 - 249 E Howard St
- 1006 Rose Hill Ave
- 1040 Pope Ave
- 1037 & 1037 1/2 Spruce St
- 801 Maryland Ave
- Lot 7-16 Lawton Ln
- 1026 101 Brinker Dr
- 1026 302 Brinker Dr
- 1004 202 Brinker Dr
- 324 W Howard St
- 618 Chestnut St
- 614 Chestnut St
- 843 Frederick St
- 213 Garlinger Ave
- 622 Knightsbridge Dr
- 0 Kenly Ave
- 604 Picadilly Dr
- 910 Corbett St
- 918 Corbett St
- 906 Corbett St
- 920 Corbett St
- 920 Corbett St Unit GARAGE
- 904 Corbett St
- 922 Corbett St
- 900 Corbett St
- 915 Rose Hill Ave
- 917 Rose Hill Ave
- 923 Rose Hill Ave
- 923 Rose Hill Ave Unit 4
- 923 Rose Hill Ave
- 909 Rose Hill Ave
- 919 Rose Hill Ave
- 905 Rose Hill Ave
- 915 Corbett St
- 911 Corbett St
- 934 Corbett St
- 923 Corbett St