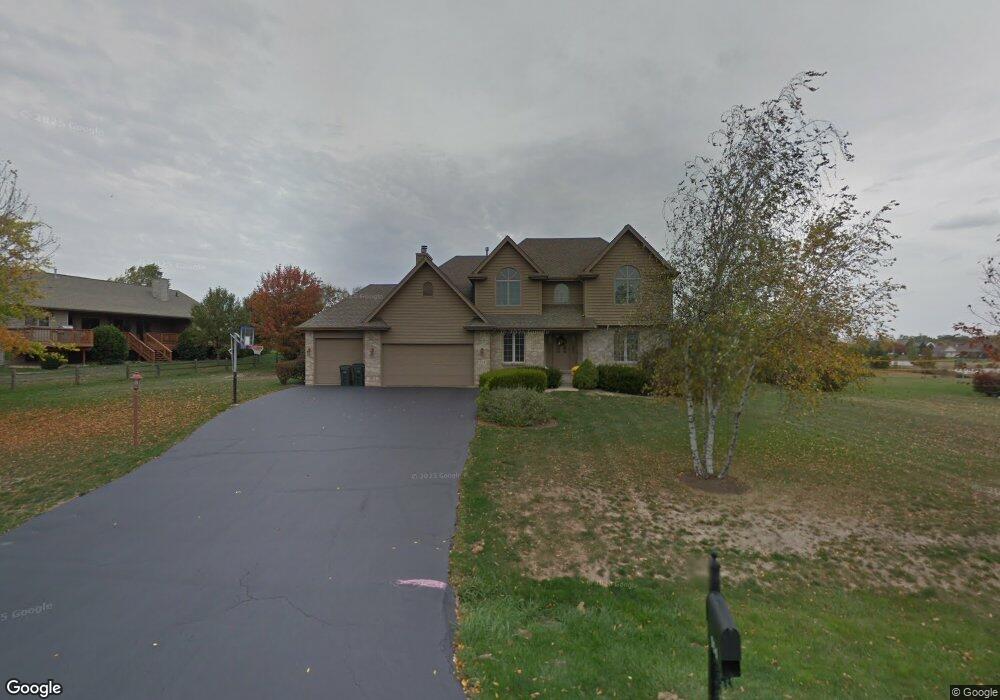
914 Dolder Ln Spring Grove, IL 60081
Estimated Value: $487,191 - $570,000
--
Bed
--
Bath
2,652
Sq Ft
$195/Sq Ft
Est. Value
About This Home
This home is located at 914 Dolder Ln, Spring Grove, IL 60081 and is currently estimated at $516,798, approximately $194 per square foot. 914 Dolder Ln is a home located in McHenry County with nearby schools including Richmond Grade School, Luther J Schilling School, and Nippersink Middle School.
Ownership History
Date
Name
Owned For
Owner Type
Purchase Details
Closed on
Apr 30, 1998
Sold by
Brown Patricia E
Bought by
Spohr Donald B and Spohr Karen E
Current Estimated Value
Home Financials for this Owner
Home Financials are based on the most recent Mortgage that was taken out on this home.
Original Mortgage
$225,000
Outstanding Balance
$44,539
Interest Rate
7.25%
Mortgage Type
Purchase Money Mortgage
Estimated Equity
$472,259
Purchase Details
Closed on
Sep 14, 1995
Sold by
Old Kent Bank
Bought by
Brown Willard and Brown Patricia E
Home Financials for this Owner
Home Financials are based on the most recent Mortgage that was taken out on this home.
Original Mortgage
$211,500
Interest Rate
7.87%
Mortgage Type
Purchase Money Mortgage
Purchase Details
Closed on
Dec 8, 1994
Sold by
Mchenry State Bank
Bought by
Old Kent Bank
Create a Home Valuation Report for This Property
The Home Valuation Report is an in-depth analysis detailing your home's value as well as a comparison with similar homes in the area
Home Values in the Area
Average Home Value in this Area
Purchase History
| Date | Buyer | Sale Price | Title Company |
|---|---|---|---|
| Spohr Donald B | $239,000 | -- | |
| Brown Willard | $235,000 | Northern Land Title Corp | |
| Old Kent Bank | $37,500 | Northern Land Title Corp |
Source: Public Records
Mortgage History
| Date | Status | Borrower | Loan Amount |
|---|---|---|---|
| Open | Spohr Donald B | $225,000 | |
| Previous Owner | Brown Willard | $211,500 |
Source: Public Records
Tax History Compared to Growth
Tax History
| Year | Tax Paid | Tax Assessment Tax Assessment Total Assessment is a certain percentage of the fair market value that is determined by local assessors to be the total taxable value of land and additions on the property. | Land | Improvement |
|---|---|---|---|---|
| 2024 | $10,140 | $143,006 | $21,072 | $121,934 |
| 2023 | $10,077 | $133,376 | $19,653 | $113,723 |
| 2022 | $9,479 | $117,326 | $17,288 | $100,038 |
| 2021 | $9,010 | $110,601 | $16,297 | $94,304 |
| 2020 | $8,810 | $105,727 | $15,579 | $90,148 |
| 2019 | $8,867 | $104,083 | $15,337 | $88,746 |
| 2018 | $9,048 | $100,866 | $14,863 | $86,003 |
| 2017 | $8,924 | $94,719 | $13,957 | $80,762 |
| 2016 | $8,961 | $90,458 | $13,329 | $77,129 |
| 2013 | -- | $94,106 | $14,208 | $79,898 |
Source: Public Records
Map
Nearby Homes
- 8789 Bentley Ln
- 8610 Steeple Ln
- 8501 Country Shire Ln
- 8303 Appaloosa Ln
- 8300 Appaloosa Ln
- 7822 N Pillow Hill Rd
- 7830 N Pillow Hill Rd
- 1914 Spring Dale Dr
- Lot 65 & 66 Main Street Rd
- Lot 61 Beverly Way
- Lot 57 Beverly Way
- Lot 59 Beverly Way
- Lot 64 Beverly Way
- Lot 60 Beverly Way
- Lot 58 Beverly Way
- LOT 56 Beverly Way
- 9436 Bellaire Ln
- 2214 Main Street Rd
- 1410 Linden Rd
- 535 Deer Run