
Seller's Agent in 2020
Erica Mcphail
Centex Priority Real Estate
(254) 338-2122
140 Total Sales
Estimated Value: $166,282 - $179,000
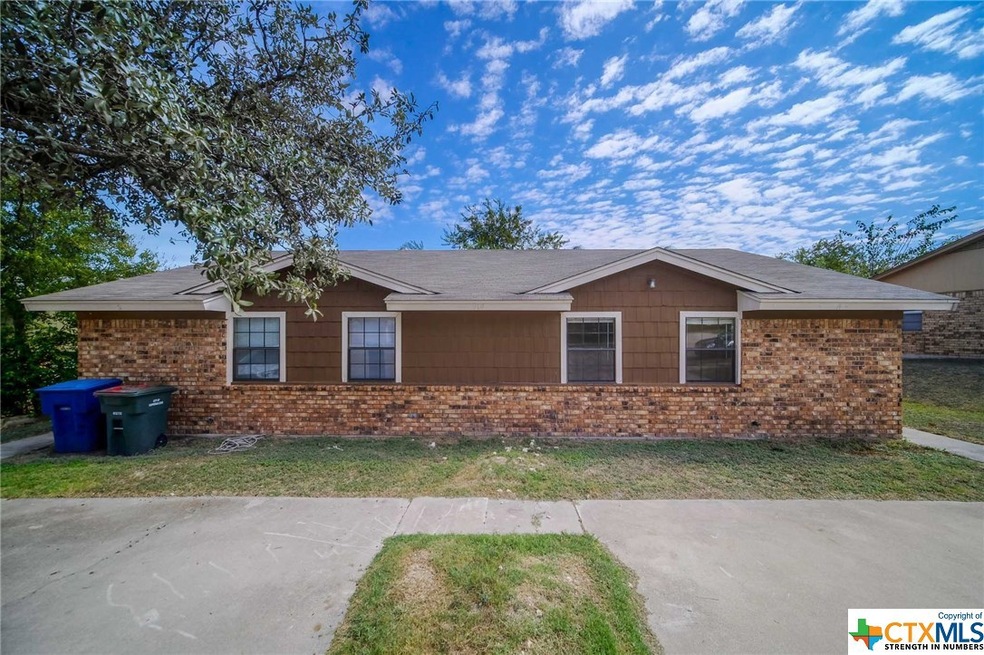
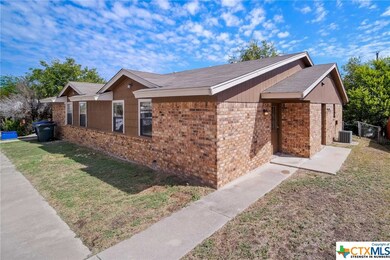
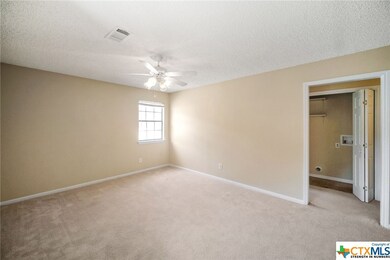
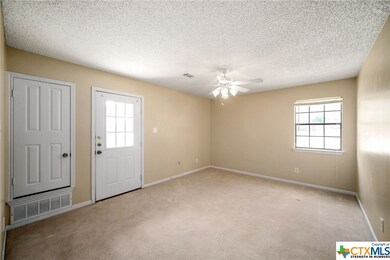
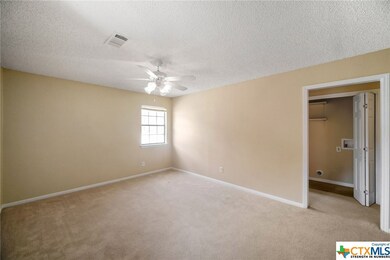
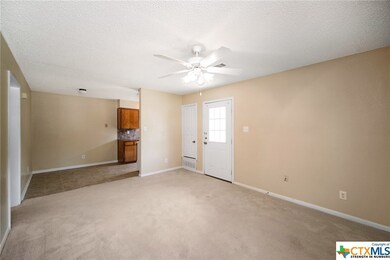
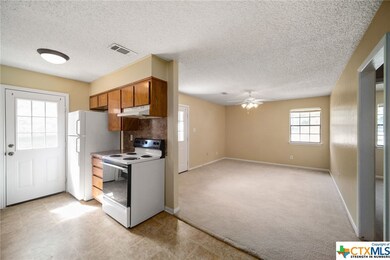
Great investment opportunity! One side is vacant for owner occupancy! Each side features 3 bedroom, 2 bathroom, with 1040 sq ft! Unit B is currently occupied with lease until 9/30/2020. Schedule your showing today!
Last Agent to Sell the Property
Centex Priority Real Estate License #0590471 Listed on: 10/16/2019
| Date | Buyer | Sale Price | Title Company |
|---|---|---|---|
| Oxford Peggy J | -- | None Available | |
| Collins Lisa Hayman | -- | None Available | |
| Williams Christina A | -- | -- |
| Date | Status | Borrower | Loan Amount |
|---|---|---|---|
| Previous Owner | Williams Christina A | $95,550 |
| Date | Event | Price | List to Sale | Price per Sq Ft |
|---|---|---|---|---|
| 01/15/2020 01/15/20 | Sold | -- | -- | -- |
| 12/16/2019 12/16/19 | Pending | -- | -- | -- |
| 10/16/2019 10/16/19 | For Sale | $130,000 | -- | $63 / Sq Ft |
| Year | Tax Paid | Tax Assessment Tax Assessment Total Assessment is a certain percentage of the fair market value that is determined by local assessors to be the total taxable value of land and additions on the property. | Land | Improvement |
|---|---|---|---|---|
| 2025 | $3,416 | $146,740 | $16,500 | $130,240 |
| 2023 | $3,416 | $152,312 | $16,500 | $135,812 |
| 2022 | $4,363 | $194,480 | $12,500 | $181,980 |
| 2021 | $2,947 | $114,330 | $12,500 | $101,830 |
| 2020 | $2,992 | $114,270 | $12,500 | $101,770 |
| 2019 | $2,761 | $101,820 | $12,500 | $89,320 |
| 2018 | $2,822 | $103,990 | $12,500 | $91,490 |
| 2017 | $2,526 | $95,000 | $12,500 | $82,500 |
| 2016 | $2,526 | $95,000 | $12,500 | $82,500 |
| 2015 | $2,429 | $98,420 | $14,380 | $84,040 |
| 2014 | $2,429 | $97,880 | $14,380 | $83,500 |
Seller's Agent in 2020
Erica Mcphail
Centex Priority Real Estate
(254) 338-2122
140 Total Sales
P
Buyer's Agent in 2020
Peggy Oxford
Keller Williams Advantage-Temple
(915) 588-0820
3 Total Sales
Source: Central Texas MLS (CTXMLS)
MLS Number: 392672
APN: 119009
Disclaimer: Certain information contained herein is derived from information provided by parties other than Homes.com. All information provided is deemed reliable, but is not guaranteed to be accurate and should be independently verified.
![]() Listing and property data is from an Internet Data Exchange (IDX) provided by the Central Texas MLS.
Listing and property data is from an Internet Data Exchange (IDX) provided by the Central Texas MLS.
Some properties which appear for sale on the website may no longer be available because they are for instance, under contract, sold or are no longer being offered for sale.
IDX information is provided exclusively for personal, non-commercial use, and may not be used for any purpose other than to identify prospective properties consumers may be interested in purchasing.
Information is deemed reliable but not guaranteed.
Copyright 2025 Central Texas MLS, All Rights Reserved.