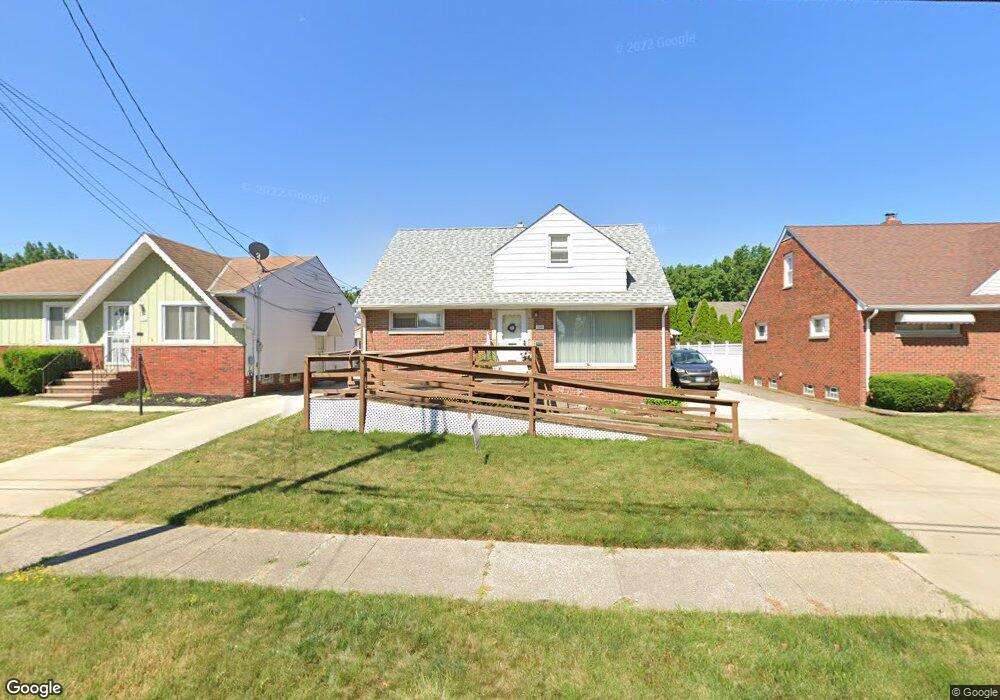
914 E 248th St Euclid, OH 44123
Estimated Value: $143,440 - $164,000
About This Home
This home is located at 914 E 248th St, Euclid, OH 44123 and is currently estimated at $154,360, approximately $128 per square foot. 914 E 248th St is a home located in Cuyahoga County with nearby schools including Bluestone Elementary School, Euclid High School, and Pinnacle Academy.
Ownership History
We collect this data history from publicly available records. To have your information removed, we recommend requesting removal directly through your county’s website.
Purchase Details
Purchase Details
Purchase Details
Purchase Details
Purchase Details
Purchase Details
Purchase Details
Home Values in the Area
Average Home Value in this Area
Purchase History
We collect this data history from publicly available records. To have your information removed, we recommend requesting removal directly through your county’s website.
| Date | Buyer | Sale Price | Title Company |
|---|---|---|---|
| -- | Attorney | ||
| -- | Attorney | ||
| -- | Attorney | ||
| $79,000 | -- | ||
| -- | -- | ||
| -- | -- | ||
| -- | -- | ||
| -- | -- |
Tax History
We collect this data history from publicly available records. To have your information removed, we recommend requesting removal directly through your county’s website.
| Year | Tax Paid | Tax Assessment Tax Assessment Total Assessment is a certain percentage of the fair market value that is determined by local assessors to be the total taxable value of land and additions on the property. | Land | Improvement |
|---|---|---|---|---|
| 2025 | $2,269 | $44,520 | $7,840 | $36,680 |
| 2024 | $2,433 | $44,520 | $7,840 | $36,680 |
| 2023 | $1,892 | $30,320 | $5,920 | $24,400 |
| 2022 | $1,884 | $30,310 | $5,920 | $24,400 |
| 2021 | $2,090 | $30,310 | $5,920 | $24,400 |
| 2020 | $1,868 | $26,150 | $5,110 | $21,040 |
| 2019 | $1,677 | $74,700 | $14,600 | $60,100 |
| 2018 | $1,636 | $26,150 | $5,110 | $21,040 |
| 2017 | $1,710 | $23,420 | $4,380 | $19,040 |
| 2016 | $1,714 | $23,420 | $4,380 | $19,040 |
| 2015 | $1,565 | $23,420 | $4,380 | $19,040 |
| 2014 | $1,565 | $23,420 | $4,380 | $19,040 |
Map
- 24831 Stephen Ave
- 24350 Stephen Ave
- 24401 Russell Ave
- 797 Babbitt Rd Unit 15
- 797 Babbitt Rd Unit 30
- 23208 Bennington Hamlet Cir
- 24570 Glenforest Rd
- 23861 Colbourne Rd
- 730 Babbitt Rd
- 24431 Hartland Rd
- 24401 Hartland Rd
- 24371 Hartland Dr
- 663 Babbitt Rd
- 805 E 254th St
- 871 E 232nd St
- 599 E 250th St
- 442 Clearview Dr Unit U9
- 22751 Fox Ave
- 25650 Richards Ave
- 22601 Ivan Ave
- 910 E 248th St
- 920 E 248th St
- 930 E 248th St
- 900 E 248th St
- 885 E 245th St
- 891 E 245th St
- 881 E 245th St
- 901 E 245th St
- 890 E 248th St
- 934 E 248th St
- 934 E 248th St Unit E
- 873 E 245th St
- 911 E 245th St
- 915 E 248th St
- 911 E 248th St
- 921 E 248th St
- 895 E 248th St
- 871 E 245th St
- 905 E 248th St
- 940 E 248th St
Ask me questions while you tour the home.