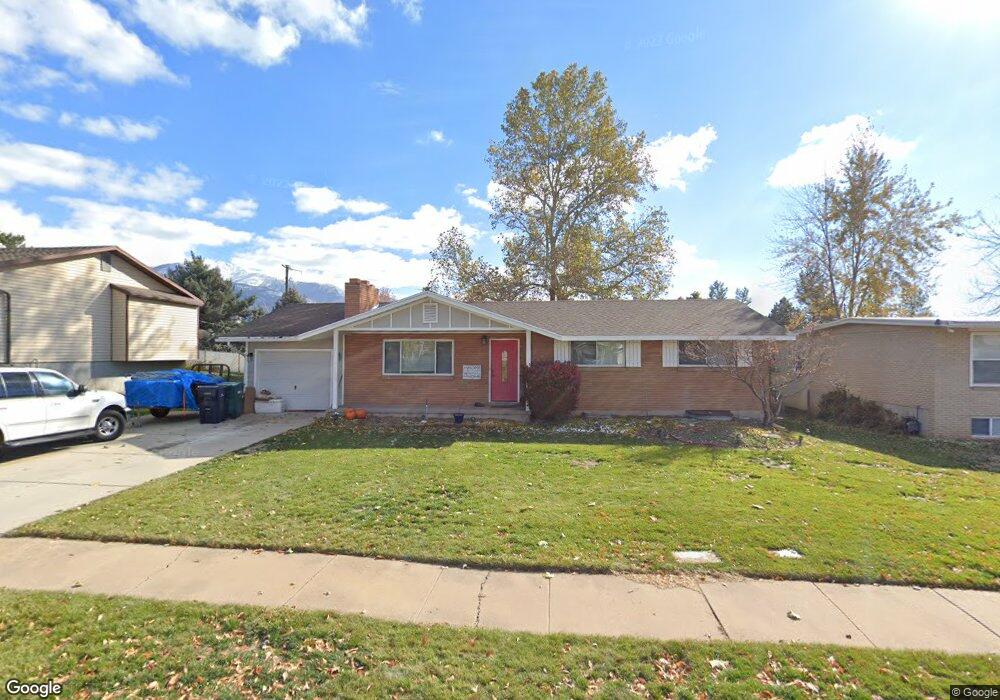
914 E 300 N Layton, UT 84041
Estimated Value: $451,000 - $542,000
5
Beds
3
Baths
2,490
Sq Ft
$191/Sq Ft
Est. Value
About This Home
This home is located at 914 E 300 N, Layton, UT 84041 and is currently estimated at $476,262, approximately $191 per square foot. 914 E 300 N is a home located in Davis County with nearby schools including Whitesides Elementary School, Central Davis Junior High School, and Layton High School.
Ownership History
Date
Name
Owned For
Owner Type
Purchase Details
Closed on
Dec 20, 2000
Sold by
Anderson Grant O and Anderson Barbara
Bought by
Anderson Barton R and Anderson Melanie J
Current Estimated Value
Home Financials for this Owner
Home Financials are based on the most recent Mortgage that was taken out on this home.
Original Mortgage
$114,059
Outstanding Balance
$40,971
Interest Rate
7.71%
Mortgage Type
FHA
Estimated Equity
$435,291
Purchase Details
Closed on
Jan 22, 2000
Sold by
Mortensen Brad and Mortensen Claudia
Bought by
Anderson Grant O and Anderson Barbara
Home Financials for this Owner
Home Financials are based on the most recent Mortgage that was taken out on this home.
Original Mortgage
$129,677
Interest Rate
7.87%
Mortgage Type
VA
Create a Home Valuation Report for This Property
The Home Valuation Report is an in-depth analysis detailing your home's value as well as a comparison with similar homes in the area
Home Values in the Area
Average Home Value in this Area
Purchase History
| Date | Buyer | Sale Price | Title Company |
|---|---|---|---|
| Anderson Barton R | -- | Gateway Title Insurance Agen | |
| Anderson Grant O | -- | Bonneville Title Company Inc |
Source: Public Records
Mortgage History
| Date | Status | Borrower | Loan Amount |
|---|---|---|---|
| Open | Anderson Barton R | $114,059 | |
| Closed | Anderson Grant O | $129,677 |
Source: Public Records
Tax History
| Year | Tax Paid | Tax Assessment Tax Assessment Total Assessment is a certain percentage of the fair market value that is determined by local assessors to be the total taxable value of land and additions on the property. | Land | Improvement |
|---|---|---|---|---|
| 2025 | $2,290 | $240,350 | $113,461 | $126,889 |
| 2024 | $2,179 | $230,450 | $131,482 | $98,968 |
| 2023 | $2,050 | $382,000 | $150,388 | $231,612 |
| 2022 | $2,146 | $217,250 | $81,594 | $135,656 |
| 2021 | $1,994 | $301,000 | $120,167 | $180,833 |
| 2020 | $1,775 | $257,000 | $98,679 | $158,321 |
| 2019 | $1,749 | $248,000 | $91,558 | $156,442 |
| 2018 | $1,587 | $226,000 | $91,558 | $134,442 |
| 2016 | $1,375 | $100,980 | $30,812 | $70,168 |
| 2015 | $1,323 | $92,290 | $30,812 | $61,478 |
| 2014 | $1,485 | $105,897 | $30,812 | $75,085 |
| 2013 | -- | $82,990 | $18,770 | $64,220 |
Source: Public Records
Map
Nearby Homes
- 187 N Talbot Dr
- 508 N Adamswood Rd
- 556 N Fairfield Rd Unit A2
- 556 N Fairfield Rd Unit D1
- 556 N Fairfield Rd Unit D2
- 556 N Fairfield Rd Unit A3
- 556 N Fairfield Rd Unit D3
- 556 N Fairfield Rd Unit D4
- 556 N Fairfield Rd Unit A1
- 556 N Fairfield Rd Unit A4
- 861 E 575 N
- 479 N 1375 E
- 9 Colonial Ave
- 1503 E 530 N
- 997 E 825 N
- 149 N Fort Ln Unit 1D
- 1033 E 825 N
- 1137 Holmes Creek Ln
- 1515 E Gentile St
- 86 Mill Rd
Your Personal Tour Guide
Ask me questions while you tour the home.