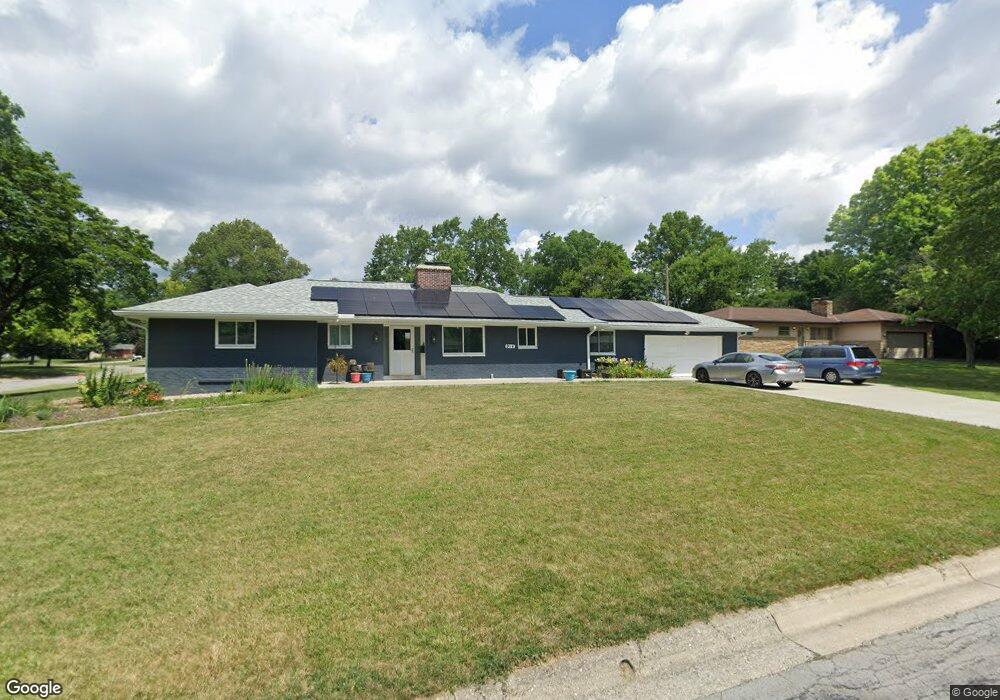
914 Meadowview Dr Columbus, OH 43224
Maize-Morse NeighborhoodEstimated Value: $342,957 - $401,000
3
Beds
3
Baths
1,780
Sq Ft
$207/Sq Ft
Est. Value
About This Home
This home is located at 914 Meadowview Dr, Columbus, OH 43224 and is currently estimated at $368,239, approximately $206 per square foot. 914 Meadowview Dr is a home located in Franklin County with nearby schools including Maize Road Elementary School, Medina Middle School, and Mifflin High School.
Ownership History
Date
Name
Owned For
Owner Type
Purchase Details
Closed on
Jul 13, 2020
Sold by
West Scott
Bought by
Michaels Alan L and Michaels Kailianu V
Current Estimated Value
Home Financials for this Owner
Home Financials are based on the most recent Mortgage that was taken out on this home.
Original Mortgage
$126,500
Outstanding Balance
$112,172
Interest Rate
3.1%
Mortgage Type
New Conventional
Estimated Equity
$256,067
Purchase Details
Closed on
Aug 8, 2019
Sold by
Elasky Lynne
Bought by
West Scott
Home Financials for this Owner
Home Financials are based on the most recent Mortgage that was taken out on this home.
Original Mortgage
$176,800
Interest Rate
2.62%
Mortgage Type
Adjustable Rate Mortgage/ARM
Purchase Details
Closed on
Sep 5, 2018
Sold by
Elasky Lynne and Davis Berneice W
Bought by
Elasky Lynne
Purchase Details
Closed on
Jun 30, 2017
Sold by
Davis Berneice W
Bought by
Elasky Lynne
Purchase Details
Closed on
Dec 23, 1991
Bought by
Davis Berneice W
Purchase Details
Closed on
Sep 1, 1983
Create a Home Valuation Report for This Property
The Home Valuation Report is an in-depth analysis detailing your home's value as well as a comparison with similar homes in the area
Home Values in the Area
Average Home Value in this Area
Purchase History
| Date | Buyer | Sale Price | Title Company |
|---|---|---|---|
| Michaels Alan L | $253,000 | None Available | |
| West Scott | $221,000 | None Available | |
| Elasky Lynne | -- | None Available | |
| Elasky Lynne | -- | None Available | |
| Davis Berneice W | -- | -- | |
| -- | $79,500 | -- |
Source: Public Records
Mortgage History
| Date | Status | Borrower | Loan Amount |
|---|---|---|---|
| Open | Michaels Alan L | $126,500 | |
| Closed | West Scott | $176,800 |
Source: Public Records
Tax History Compared to Growth
Tax History
| Year | Tax Paid | Tax Assessment Tax Assessment Total Assessment is a certain percentage of the fair market value that is determined by local assessors to be the total taxable value of land and additions on the property. | Land | Improvement |
|---|---|---|---|---|
| 2024 | $4,475 | $99,720 | $23,280 | $76,440 |
| 2023 | $4,418 | $99,715 | $23,275 | $76,440 |
| 2022 | $5,458 | $70,110 | $13,860 | $56,250 |
| 2021 | $3,643 | $70,110 | $13,860 | $56,250 |
| 2020 | $3,647 | $70,110 | $13,860 | $56,250 |
| 2019 | $3,432 | $56,570 | $11,100 | $45,470 |
| 2018 | $2,754 | $56,570 | $11,100 | $45,470 |
| 2017 | $2,899 | $56,570 | $11,100 | $45,470 |
| 2016 | $2,880 | $52,220 | $9,450 | $42,770 |
| 2015 | $2,614 | $52,220 | $9,450 | $42,770 |
| 2014 | $2,620 | $52,220 | $9,450 | $42,770 |
| 2013 | $1,374 | $54,950 | $9,940 | $45,010 |
Source: Public Records
Map
Nearby Homes
- 814 Meadowview Dr
- 1064 Hillsdale Dr
- 1130 Carbone Dr
- 4441 Wetmore Rd E
- 1191 Bryson Rd
- 4193 Eastlea Dr
- 995 Overbrook Service Dr
- 1071 Loring Rd
- 4000 Indianola Ave
- 4299 Colerain Ave
- 1266 Pershing Dr
- 685 Yaronia Dr N
- 3808 Maize Rd
- 4119 Karl Rd Unit 108
- 924 Northridge Rd
- 522 E Beechwold Blvd
- 3724 Eisenhower Rd
- 3941 Karl Rd Unit 326
- 4143 Karl Rd Unit 314
- 4145 Karl Rd Unit 223
- 898 Inwood Place
- 928 Meadowview Dr
- 894 Inwood Place
- 919 Meadowview Dr
- 907 Meadowview Dr
- 899 Inwood Place
- 4315 Sandy Lane Rd
- 929 Meadowview Dr
- 899 Meadowview Dr
- 885 Inwood Place
- 4331 Sandy Lane Rd
- 890 Inwood Place
- 939 Meadowview Dr
- 887 Meadowview Dr
- 876 Meadowview Dr
- 881 Inwood Place
- 886 Inwood Place
- 953 Meadowview Dr
- 4302 Meadowview Ct
- 879 Meadowview Dr