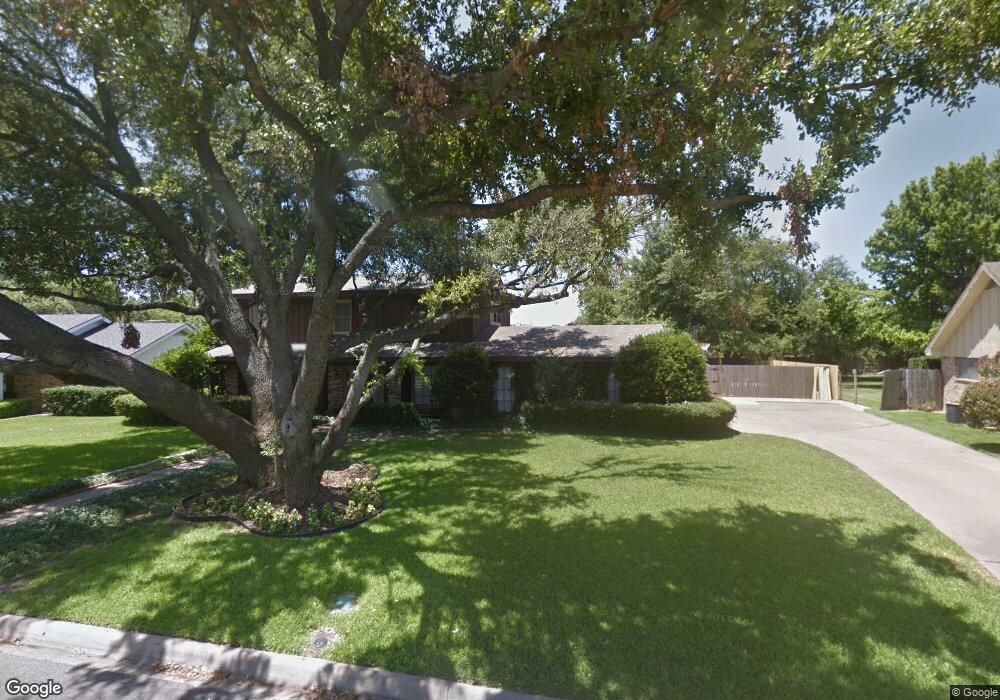
914 S Colonial Dr Cleburne, TX 76033
Estimated Value: $396,000 - $454,000
3
Beds
3
Baths
2,777
Sq Ft
$150/Sq Ft
Est. Value
About This Home
This home is located at 914 S Colonial Dr, Cleburne, TX 76033 and is currently estimated at $416,576, approximately $150 per square foot. 914 S Colonial Dr is a home located in Johnson County with nearby schools including Coleman Elementary School, Lowell Smith Jr. Middle School, and Cleburne High School.
Ownership History
Date
Name
Owned For
Owner Type
Purchase Details
Closed on
Jul 22, 2016
Sold by
Rosser Leslie L and Rosser Randall S
Bought by
Price Keli and Price Duane
Current Estimated Value
Home Financials for this Owner
Home Financials are based on the most recent Mortgage that was taken out on this home.
Original Mortgage
$222,227
Outstanding Balance
$181,941
Interest Rate
4.4%
Mortgage Type
FHA
Estimated Equity
$234,635
Purchase Details
Closed on
Sep 13, 2010
Sold by
Ginn Perry D and Ginn Deborah L
Bought by
Rosser Leslie L and Rosser Randall S
Home Financials for this Owner
Home Financials are based on the most recent Mortgage that was taken out on this home.
Original Mortgage
$135,375
Interest Rate
4.51%
Mortgage Type
New Conventional
Purchase Details
Closed on
May 16, 2005
Sold by
Lanham Wanda Marie Van Zandt and Van Zandt Great Grandchildrens
Bought by
Lanham Michael Van Zandt and Lanham Sonya
Create a Home Valuation Report for This Property
The Home Valuation Report is an in-depth analysis detailing your home's value as well as a comparison with similar homes in the area
Home Values in the Area
Average Home Value in this Area
Purchase History
| Date | Buyer | Sale Price | Title Company |
|---|---|---|---|
| Price Keli | -- | Capital Title | |
| Rosser Leslie L | -- | Hexter Fair Title Company | |
| Lanham Michael Van Zandt | -- | None Available |
Source: Public Records
Mortgage History
| Date | Status | Borrower | Loan Amount |
|---|---|---|---|
| Open | Price Keli | $222,227 | |
| Previous Owner | Rosser Leslie L | $135,375 |
Source: Public Records
Tax History Compared to Growth
Tax History
| Year | Tax Paid | Tax Assessment Tax Assessment Total Assessment is a certain percentage of the fair market value that is determined by local assessors to be the total taxable value of land and additions on the property. | Land | Improvement |
|---|---|---|---|---|
| 2025 | $7,151 | $416,185 | $52,000 | $364,185 |
| 2024 | $8,670 | $388,832 | $0 | $0 |
| 2023 | $6,404 | $416,185 | $52,000 | $364,185 |
| 2022 | $9,007 | $359,900 | $52,000 | $307,900 |
| 2021 | $7,622 | $292,135 | $39,500 | $252,635 |
| 2020 | $7,533 | $271,848 | $35,000 | $236,848 |
| 2019 | $8,033 | $271,848 | $35,000 | $236,848 |
| 2018 | $7,901 | $267,272 | $35,000 | $232,272 |
| 2017 | $7,527 | $255,707 | $35,000 | $220,707 |
| 2016 | $6,008 | $204,096 | $35,000 | $169,096 |
| 2015 | $4,695 | $185,876 | $35,000 | $150,876 |
| 2014 | $4,695 | $190,526 | $35,000 | $155,526 |
Source: Public Records
Map
Nearby Homes
- 806 S Colonial Dr
- 1327 Hemphill Dr
- 1105 Hemphill Ct
- 1302 Cindy Ct
- 1211 Greenbriar Ln
- 1304 Bradley Ct
- 1307 Bradley Ct
- 1209 Stonelake Dr
- 1602 Murry Dr
- 1208 Cindy Ln
- 509 S Nolan River Rd
- 1225 Crestwood Dr
- 1309 Wedgewood Dr
- 840 S Ridgeway Dr
- 906 Chestnut Grove Dr
- 814 Chestnut Grove Dr
- 1204 W Westhill Dr
- 709 Stonelake Dr
- 504 S Colonial Dr
- 1116 Willowcreek Rd
- 916 S Colonial Dr
- 912 S Colonial Dr
- 917 Stonelake Dr
- 915 Stonelake Dr
- 919 Stonelake Dr
- 913 S Colonial Dr
- 915 S Colonial Dr
- 910 S Colonial Dr
- 913 Stonelake Dr
- 1304 Surry Place Dr
- 918 S Colonial Dr
- 911 S Colonial Dr
- 917 S Colonial Dr
- 921 Stonelake Dr
- 911 Stonelake Dr
- 1243 Hilltop Dr
- 908 S Colonial Dr
- 916 Stonelake Dr
- 1236 Greenbriar Ln
- 914 Stonelake Dr