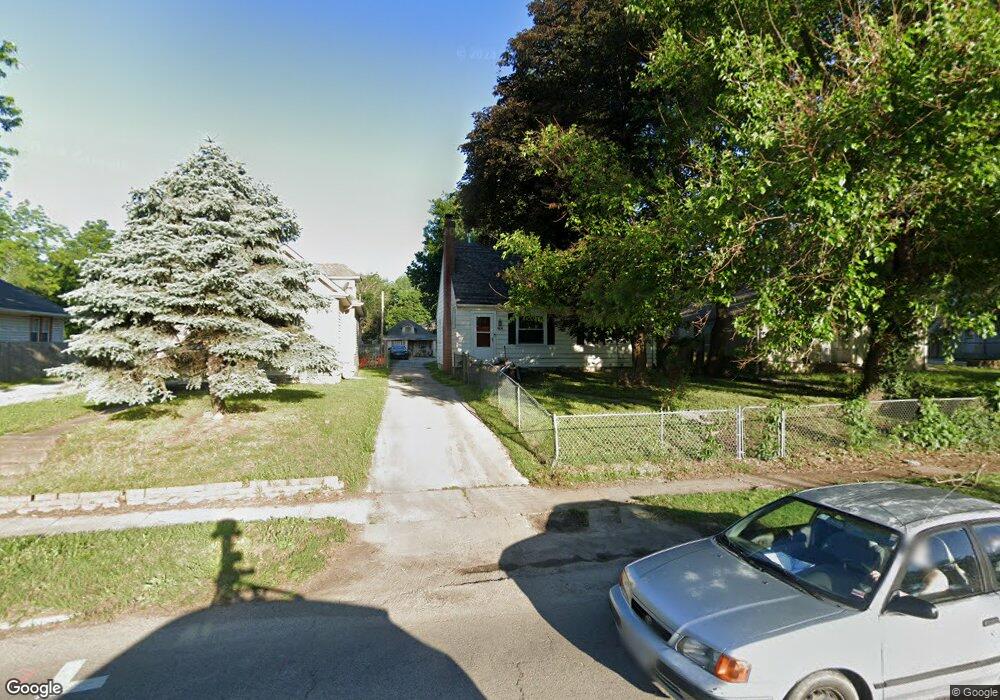
914 S Noland Rd Independence, MO 64050
Heart of Independence NeighborhoodEstimated Value: $187,000 - $216,000
4
Beds
4
Baths
2,026
Sq Ft
$98/Sq Ft
Est. Value
About This Home
This home is located at 914 S Noland Rd, Independence, MO 64050 and is currently estimated at $197,676, approximately $97 per square foot. 914 S Noland Rd is a home located in Jackson County with nearby schools including Santa Fe Trail Elementary School, Bridger Middle School, and Bingham Middle School.
Ownership History
Date
Name
Owned For
Owner Type
Purchase Details
Closed on
Oct 8, 2019
Sold by
Miller David J
Bought by
Taylor Nikita and Floyd Shawnna
Current Estimated Value
Purchase Details
Closed on
Jun 15, 2011
Sold by
Wood Rebbecca Lake
Bought by
Miller David J and Borntreger Moses
Purchase Details
Closed on
May 12, 2004
Sold by
Sloan Bryan and Sloan Kathryn
Bought by
Miller David J and Whitley Karen Kay
Home Financials for this Owner
Home Financials are based on the most recent Mortgage that was taken out on this home.
Original Mortgage
$72,800
Interest Rate
5.81%
Mortgage Type
Purchase Money Mortgage
Purchase Details
Closed on
Apr 29, 2003
Sold by
Sloan Kelly
Bought by
Sloan Bryan
Purchase Details
Closed on
Mar 12, 2003
Sold by
Wachovia Bank Of Delaware Na
Bought by
Sloan Bryan and Sloan Kelly
Purchase Details
Closed on
Nov 4, 2002
Sold by
Malolo Sandra
Bought by
Wachovia Bank Of Delaware Na and First Union National Bank Of Delaware
Create a Home Valuation Report for This Property
The Home Valuation Report is an in-depth analysis detailing your home's value as well as a comparison with similar homes in the area
Home Values in the Area
Average Home Value in this Area
Purchase History
| Date | Buyer | Sale Price | Title Company |
|---|---|---|---|
| Taylor Nikita | -- | None Available | |
| Miller David J | -- | None Available | |
| Miller David J | -- | Security Land Title Company | |
| Sloan Bryan | -- | Old Republic Title Of Ks Cit | |
| Sloan Bryan | $35,000 | Old Republic Title Of Ks Cit | |
| Sloan Bryan | -- | -- | |
| Wachovia Bank Of Delaware Na | $60,044 | -- |
Source: Public Records
Mortgage History
| Date | Status | Borrower | Loan Amount |
|---|---|---|---|
| Previous Owner | Miller David J | $72,800 | |
| Closed | Taylor Nikita | $0 |
Source: Public Records
Tax History
| Year | Tax Paid | Tax Assessment Tax Assessment Total Assessment is a certain percentage of the fair market value that is determined by local assessors to be the total taxable value of land and additions on the property. | Land | Improvement |
|---|---|---|---|---|
| 2025 | $1,703 | $23,619 | $3,906 | $19,713 |
| 2024 | $1,664 | $24,577 | $3,433 | $21,144 |
| 2023 | $1,664 | $24,576 | $2,411 | $22,165 |
| 2022 | $1,319 | $17,860 | $3,895 | $13,965 |
| 2021 | $1,319 | $17,860 | $3,895 | $13,965 |
| 2020 | $1,293 | $17,015 | $3,895 | $13,120 |
| 2019 | $1,272 | $17,015 | $3,895 | $13,120 |
| 2018 | $1,318 | $16,833 | $2,626 | $14,207 |
| 2017 | $1,318 | $16,833 | $2,626 | $14,207 |
| 2016 | $1,298 | $16,411 | $1,957 | $14,454 |
Source: Public Records
Map
Nearby Homes
- 921 S Noland Rd
- 1100 S Noland Rd
- 904 S Pearl St
- 722 S Main St
- 813 S Liberty St
- 324 W South Ave
- 913 S Hocker Ave
- 1211 S Osage St
- 925 S Emery St
- 930 S Leslie St
- 1312 S Pearl St
- 126 E Elm St
- 1209 S Spring St
- 324 W Southside Blvd
- 903 S Pope Ave
- 1402 S Dodgion Ave
- 1020 S Mccoy St
- 1339 S Hocker Ave
- 1340 S Emery Ave
- 611 W 23rd St
- 916 S Noland Rd
- 926 S Noland Rd
- 906 S Noland Rd
- 912 S Noland Rd
- 917 S Noland Rd
- 904 S Noland Rd
- 911 S Noland Rd
- 932 S Noland Rd
- 925 S Main St
- 915 S Noland Rd
- 933 S Main St
- 913 S Noland Rd
- 921 S Main St
- 901 S Noland Rd
- 915 S Main St
- 907 S Main St
- 1000 S Noland Rd
- 939 S Main St
- 201 E South Ave
- 831 S Noland Rd
Your Personal Tour Guide
Ask me questions while you tour the home.