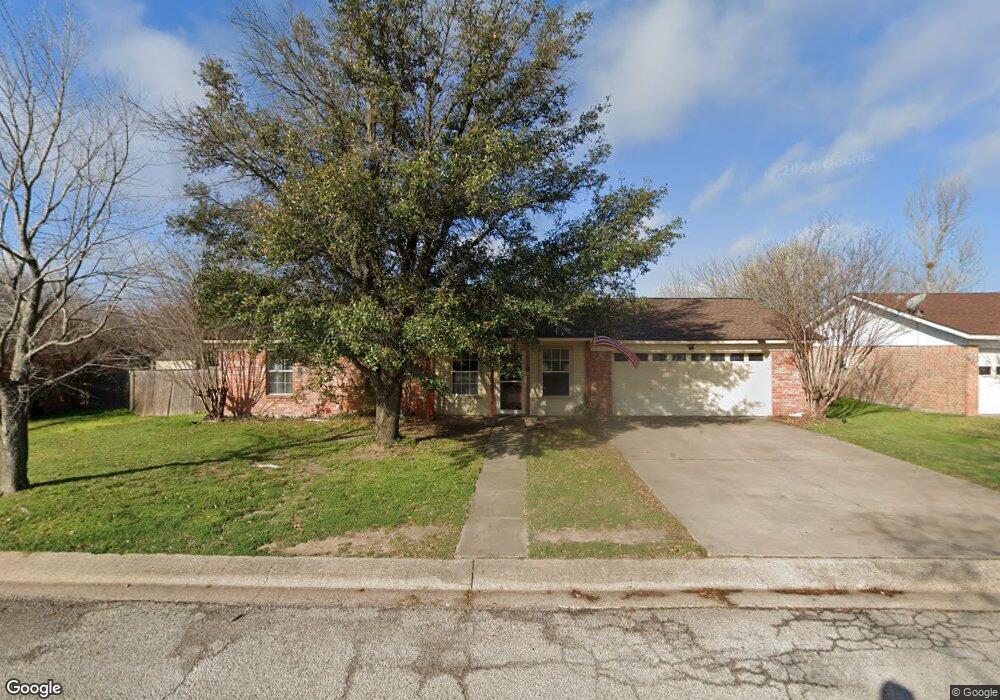
914 Sylvia St Weatherford, TX 76086
Estimated Value: $299,137 - $333,000
3
Beds
2
Baths
1,500
Sq Ft
$210/Sq Ft
Est. Value
About This Home
This home is located at 914 Sylvia St, Weatherford, TX 76086 and is currently estimated at $314,284, approximately $209 per square foot. 914 Sylvia St is a home located in Parker County with nearby schools including Ikard Elementary School, Tison Middle School, and Weatherford High School.
Ownership History
Date
Name
Owned For
Owner Type
Purchase Details
Closed on
Oct 7, 2011
Sold by
Briarpath Fund L P
Bought by
Blasingame Brandie L and Blasingame Stephen
Current Estimated Value
Home Financials for this Owner
Home Financials are based on the most recent Mortgage that was taken out on this home.
Original Mortgage
$93,566
Outstanding Balance
$64,275
Interest Rate
4.25%
Mortgage Type
FHA
Estimated Equity
$250,009
Purchase Details
Closed on
Jul 5, 2011
Sold by
Ivy Dewey G and Ivy Jacklyn G
Bought by
Blasingame Brandie L and Blasingame Stephen
Purchase Details
Closed on
Mar 19, 1999
Bought by
Blasingame Brandie L and Blasingame Stephen
Purchase Details
Closed on
Aug 8, 1995
Bought by
Blasingame Brandie L and Blasingame Stephen
Purchase Details
Closed on
Jan 6, 1994
Bought by
Blasingame Brandie L and Blasingame Stephen
Purchase Details
Closed on
Oct 25, 1993
Bought by
Blasingame Brandie L and Blasingame Stephen
Create a Home Valuation Report for This Property
The Home Valuation Report is an in-depth analysis detailing your home's value as well as a comparison with similar homes in the area
Home Values in the Area
Average Home Value in this Area
Purchase History
| Date | Buyer | Sale Price | Title Company |
|---|---|---|---|
| Blasingame Brandie L | -- | Fnt | |
| Blasingame Brandie L | -- | -- | |
| Briarpath Fund Lp | $66,099 | None Available | |
| Blasingame Brandie L | -- | -- | |
| Blasingame Brandie L | -- | -- | |
| Blasingame Brandie L | -- | -- | |
| Blasingame Brandie L | -- | -- |
Source: Public Records
Mortgage History
| Date | Status | Borrower | Loan Amount |
|---|---|---|---|
| Open | Blasingame Brandie L | $93,566 |
Source: Public Records
Tax History Compared to Growth
Tax History
| Year | Tax Paid | Tax Assessment Tax Assessment Total Assessment is a certain percentage of the fair market value that is determined by local assessors to be the total taxable value of land and additions on the property. | Land | Improvement |
|---|---|---|---|---|
| 2025 | $1,169 | $254,124 | -- | -- |
| 2024 | $1,169 | $231,022 | -- | -- |
| 2023 | $1,169 | $210,020 | $0 | $0 |
| 2022 | $4,235 | $198,600 | $20,000 | $178,600 |
| 2021 | $4,168 | $198,600 | $20,000 | $178,600 |
| 2020 | $3,813 | $172,790 | $20,000 | $152,790 |
| 2019 | $3,663 | $172,790 | $20,000 | $152,790 |
| 2018 | $3,345 | $130,410 | $20,000 | $110,410 |
| 2017 | $3,242 | $130,410 | $20,000 | $110,410 |
| 2016 | $2,947 | $112,010 | $20,000 | $92,010 |
| 2015 | $2,089 | $112,010 | $20,000 | $92,010 |
| 2014 | $2,005 | $99,870 | $20,000 | $79,870 |
Source: Public Records
Map
Nearby Homes
- 905 Terry Trail
- 307 Hickory Ln
- 305 Hickory Ln
- 107 Hickory Ln
- Horseshoe Bend Rd
- 0 Adell Cir
- The Chisholm Plan at Hickory Place Addition
- 2004 Hill Crest Ct
- 2008 Hill Crest Ct
- 207 Camelot Dr
- 228 Allen St
- 936 Eldorado St
- 934 Eldorado St
- 509 Sweetwater Dr
- 1017 Inverness Dr
- 1029 Inverness Dr
- 101 Black Forest Dr
- 916 El Dorado St
- 128 Black Forest Dr
- 522 Crow Ave
- 920 Sylvia St
- 919 Sylvia St
- 924 Sylvia St
- 912 Sylvia St
- 917 Sylvia St
- 923 Sylvia St
- 919 Terry Trail
- 917 Terry Trail
- 911 Sylvia St
- 906 Sylvia St Unit 8
- 928 Sylvia St
- 921 Terry Trail
- 925 Terry Trail
- 909 Terry Trail
- 927 Sylvia St
- 0 Sylvia 934
- 911 Terry Trail
- 902 Sylvia St Unit 4
- 0 Sylvia 936
- 907 Terry Trail