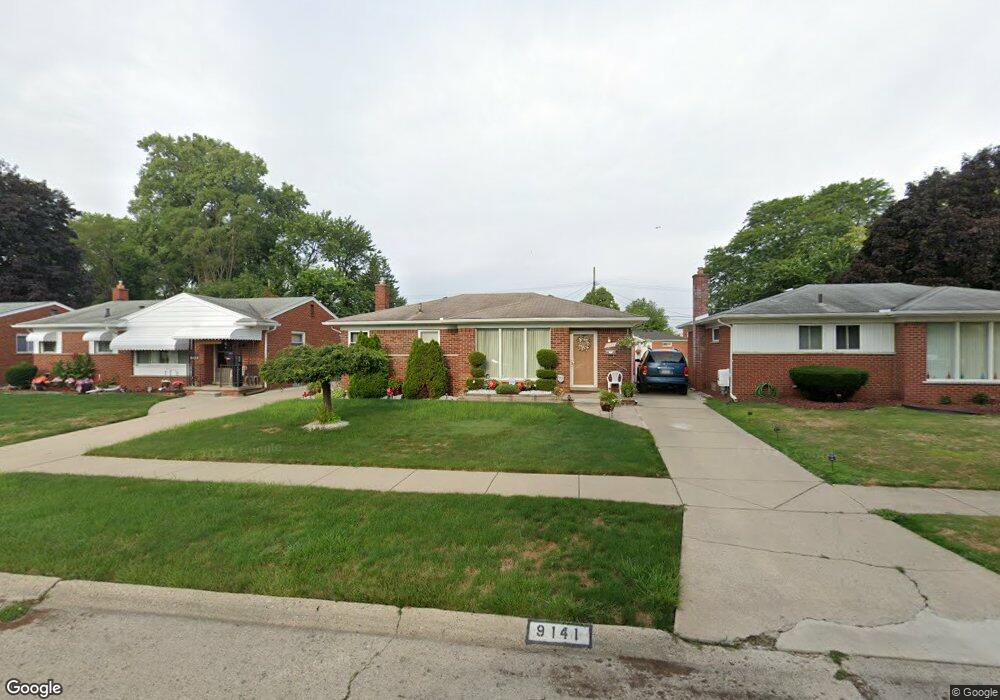
9141 Riverview Redford, MI 48239
Estimated Value: $170,032 - $206,000
Studio
1
Bath
1,013
Sq Ft
$187/Sq Ft
Est. Value
About This Home
This home is located at 9141 Riverview, Redford, MI 48239 and is currently estimated at $189,258, approximately $186 per square foot. 9141 Riverview is a home located in Wayne County with nearby schools including John D. Pierce Middle School, Lee M. Thurston High School, and Global Heights Academy.
Ownership History
Date
Name
Owned For
Owner Type
Purchase Details
Closed on
Jan 11, 2007
Sold by
Johnson Donna and Johnson Lonnie D
Bought by
Heyward Roberta
Current Estimated Value
Purchase Details
Closed on
Dec 15, 2003
Sold by
Schaefer Joseph H and Schaefer Shana M
Bought by
Johnson Donna
Purchase Details
Closed on
Feb 28, 2003
Sold by
The Revocable Living Trust Agreement Of
Bought by
Schaefer Joseph H
Purchase Details
Closed on
Aug 1, 2001
Sold by
Ward Eugenia
Bought by
Ward Eugenia
Create a Home Valuation Report for This Property
The Home Valuation Report is an in-depth analysis detailing your home's value as well as a comparison with similar homes in the area
Home Values in the Area
Average Home Value in this Area
Purchase History
| Date | Buyer | Sale Price | Title Company |
|---|---|---|---|
| Heyward Roberta | $114,200 | Multiple | |
| Johnson Donna | $115,000 | Metropolitan Title Company | |
| Schaefer Joseph H | $100,000 | Transnation Title | |
| Ward Eugenia | -- | -- |
Source: Public Records
Tax History
| Year | Tax Paid | Tax Assessment Tax Assessment Total Assessment is a certain percentage of the fair market value that is determined by local assessors to be the total taxable value of land and additions on the property. | Land | Improvement |
|---|---|---|---|---|
| 2025 | $949 | $81,200 | $0 | $0 |
| 2024 | $923 | $72,300 | $0 | $0 |
| 2023 | $882 | $62,500 | $0 | $0 |
| 2022 | $2,359 | $53,300 | $0 | $0 |
| 2021 | $2,475 | $51,100 | $0 | $0 |
| 2020 | $2,260 | $46,100 | $0 | $0 |
| 2019 | $2,309 | $35,200 | $0 | $0 |
| 2018 | $787 | $29,600 | $0 | $0 |
| 2017 | $2,388 | $27,300 | $0 | $0 |
| 2016 | $1,954 | $25,400 | $0 | $0 |
| 2015 | $2,370 | $23,700 | $0 | $0 |
| 2013 | $2,460 | $25,100 | $0 | $0 |
| 2012 | $2,178 | $27,700 | $6,900 | $20,800 |
Source: Public Records
Map
Nearby Homes
Your Personal Tour Guide
Ask me questions while you tour the home.