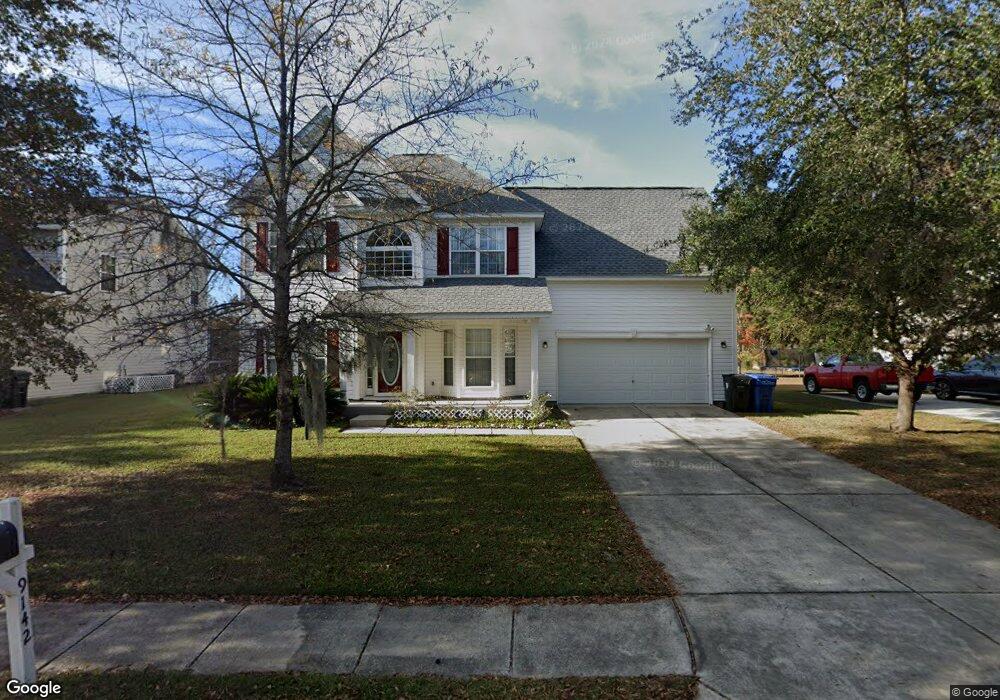
9142 Markleys Grove Blvd Summerville, SC 29485
Estimated Value: $405,255 - $443,000
4
Beds
3
Baths
2,283
Sq Ft
$188/Sq Ft
Est. Value
About This Home
This home is located at 9142 Markleys Grove Blvd, Summerville, SC 29485 and is currently estimated at $428,564, approximately $187 per square foot. 9142 Markleys Grove Blvd is a home with nearby schools including Fort Dorchester Elementary School, Oakbrook Middle School, and Fort Dorchester High School.
Ownership History
Date
Name
Owned For
Owner Type
Purchase Details
Closed on
Oct 9, 2013
Sold by
Katsir Nadav and Katsir Tonya
Bought by
Katsir Nadav and Katsir Tonya
Current Estimated Value
Purchase Details
Closed on
Sep 25, 2009
Sold by
Katsir Nadav and Katsir Tonya
Bought by
Katsir Nadav and Katsir Tonya
Home Financials for this Owner
Home Financials are based on the most recent Mortgage that was taken out on this home.
Original Mortgage
$188,000
Interest Rate
5.11%
Mortgage Type
New Conventional
Purchase Details
Closed on
Jul 1, 2008
Sold by
Brentwood Homes Of South Carolina Inc
Bought by
Katsir Nadav and Katsir Tonya Y
Purchase Details
Closed on
Mar 21, 2005
Sold by
Whipple Development Corp
Bought by
Katsir Nadav and Brown Tonya
Home Financials for this Owner
Home Financials are based on the most recent Mortgage that was taken out on this home.
Original Mortgage
$203,328
Interest Rate
5.12%
Mortgage Type
Adjustable Rate Mortgage/ARM
Create a Home Valuation Report for This Property
The Home Valuation Report is an in-depth analysis detailing your home's value as well as a comparison with similar homes in the area
Home Values in the Area
Average Home Value in this Area
Purchase History
| Date | Buyer | Sale Price | Title Company |
|---|---|---|---|
| Katsir Nadav | -- | -- | |
| Katsir Nadav | -- | -- | |
| Katsir Nadav | -- | -- | |
| Katsir Nadav | $214,030 | -- |
Source: Public Records
Mortgage History
| Date | Status | Borrower | Loan Amount |
|---|---|---|---|
| Previous Owner | Katsir Nadav | $188,000 | |
| Previous Owner | Katsir Nadav | $203,328 |
Source: Public Records
Tax History Compared to Growth
Tax History
| Year | Tax Paid | Tax Assessment Tax Assessment Total Assessment is a certain percentage of the fair market value that is determined by local assessors to be the total taxable value of land and additions on the property. | Land | Improvement |
|---|---|---|---|---|
| 2024 | $2,376 | $15,112 | $3,800 | $11,312 |
| 2023 | $2,376 | $9,787 | $2,200 | $7,587 |
| 2022 | $2,148 | $8,630 | $2,300 | $6,330 |
| 2021 | $2,085 | $8,630 | $2,300 | $6,330 |
| 2020 | $2,002 | $7,510 | $2,000 | $5,510 |
| 2019 | $1,975 | $7,510 | $2,000 | $5,510 |
| 2018 | $1,733 | $7,510 | $2,000 | $5,510 |
| 2017 | $1,676 | $7,510 | $2,000 | $5,510 |
| 2016 | $1,676 | $7,510 | $2,000 | $5,510 |
| 2015 | $1,671 | $7,510 | $2,000 | $5,510 |
| 2014 | $1,926 | $219,800 | $0 | $0 |
| 2013 | -- | $8,790 | $0 | $0 |
Source: Public Records
Map
Nearby Homes
- 5150 Trump St Unit 1401
- 5150 Trump St Unit 1206
- 5150 Trump St Unit 103
- 9209 Markleys Grove Blvd
- 4956 Bishop Green Ln
- 8800 Dorchester Rd Unit 3602
- 8800 Dorchester Rd Unit 2701
- 8800 Dorchester Rd Unit 1504
- 8800 Dorchester Rd Unit 1304
- 8800 Dorchester Rd Unit 504
- 4869 Law Blvd
- 8782 Shadowglen Dr
- 8849 Kellum Dr
- 8760 Shadowglen Dr
- 4763 Horse Drawn Way
- 8921 Skipping Rock Ln
- 4816 W Red Maple Cir
- 9443 Harroway Rd
- 8926 Cat Tail Pond Rd
- 8897 Cat Tail Pond Rd
- 9138 Markleys Grove Blvd
- 9146 Markleys Grove Blvd
- 9134 Markleys Grove Blvd
- 9169 Markleys Grove Blvd
- 9165 Markleys Grove Blvd
- 5004 Streamside Rd
- 9173 Markleys Grove Blvd
- 5008 Streamside Rd
- 9157 Markleys Grove Blvd
- 9177 Markleys Grove Blvd
- 9130 Markleys Grove Blvd
- 9153 Markleys Grove Blvd
- 5005 Streamside Rd
- 5012 Streamside Rd
- 9126 Markleys Grove Blvd
- 9149 Markleys Grove Blvd
- 5016 Streamside Rd
- 5009 Streamside Rd
- 5013 Streamside Rd
- 9122 Markleys Grove Blvd