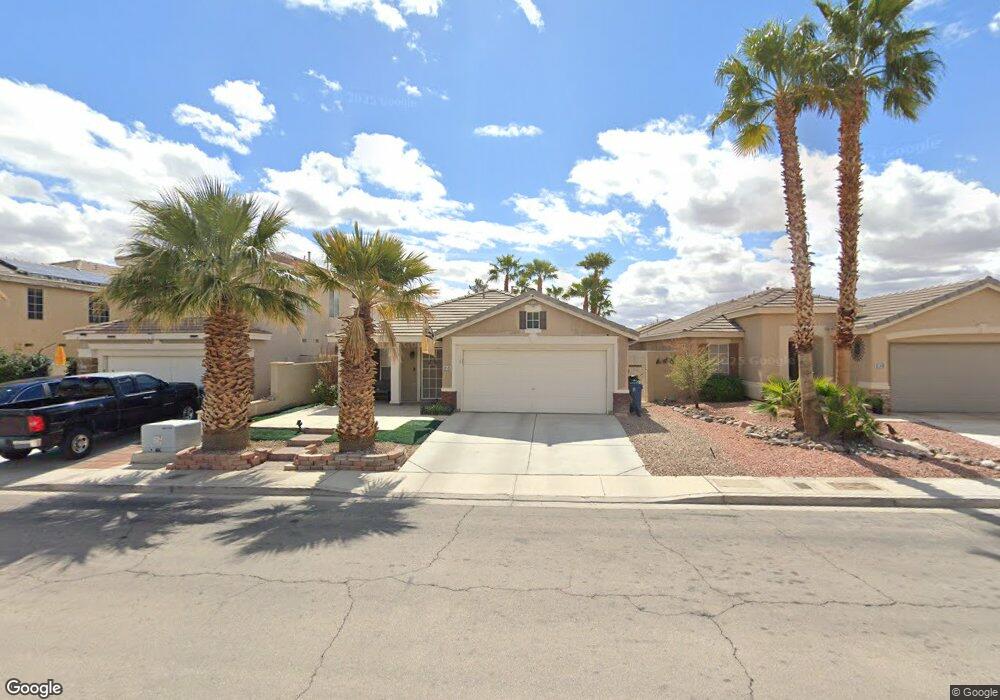
9143 Riding Heights Ave Las Vegas, NV 89147
Rancho Viejo NeighborhoodEstimated Value: $428,000 - $458,000
3
Beds
2
Baths
1,504
Sq Ft
$294/Sq Ft
Est. Value
About This Home
This home is located at 9143 Riding Heights Ave, Las Vegas, NV 89147 and is currently estimated at $441,459, approximately $293 per square foot. 9143 Riding Heights Ave is a home located in Clark County with nearby schools including Keith C. & Karen W. Hayes Elementary School, Clifford J Lawrence Junior High School, and Durango High School.
Ownership History
Date
Name
Owned For
Owner Type
Purchase Details
Closed on
Feb 21, 2005
Sold by
Axon David
Bought by
Lybolt Jeffery and Lybolt Lynda S
Current Estimated Value
Home Financials for this Owner
Home Financials are based on the most recent Mortgage that was taken out on this home.
Original Mortgage
$240,000
Outstanding Balance
$125,977
Interest Rate
6.25%
Mortgage Type
New Conventional
Estimated Equity
$315,482
Purchase Details
Closed on
Jan 30, 2004
Sold by
Gin Stanley and Gin Elda
Bought by
Axon David
Home Financials for this Owner
Home Financials are based on the most recent Mortgage that was taken out on this home.
Original Mortgage
$187,920
Interest Rate
4.75%
Mortgage Type
Unknown
Purchase Details
Closed on
Nov 17, 2001
Sold by
Gin Stanley
Bought by
Gin Stanley and Gin Elda
Purchase Details
Closed on
Nov 3, 2001
Sold by
Gin Yuet Ngan and Gin Stanley
Bought by
Gin Stanley
Purchase Details
Closed on
Dec 20, 1998
Sold by
Gin Stanley and Hale Betty
Bought by
Gin Yuet Ngan and Gin Stanley
Purchase Details
Closed on
Oct 21, 1997
Sold by
San Vicente Llc
Bought by
Gin Yuet Ngan
Create a Home Valuation Report for This Property
The Home Valuation Report is an in-depth analysis detailing your home's value as well as a comparison with similar homes in the area
Home Values in the Area
Average Home Value in this Area
Purchase History
| Date | Buyer | Sale Price | Title Company |
|---|---|---|---|
| Lybolt Jeffery | $300,000 | Chicago Title | |
| Axon David | $234,900 | Old Republic Title Co Of Ne | |
| Gin Stanley | -- | -- | |
| Gin Stanley | -- | -- | |
| Gin Yuet Ngan | -- | -- | |
| Gin Yuet Ngan | $127,500 | United Title |
Source: Public Records
Mortgage History
| Date | Status | Borrower | Loan Amount |
|---|---|---|---|
| Open | Lybolt Jeffery | $240,000 | |
| Previous Owner | Axon David | $187,920 | |
| Closed | Lybolt Jeffery | $60,000 |
Source: Public Records
Tax History Compared to Growth
Tax History
| Year | Tax Paid | Tax Assessment Tax Assessment Total Assessment is a certain percentage of the fair market value that is determined by local assessors to be the total taxable value of land and additions on the property. | Land | Improvement |
|---|---|---|---|---|
| 2025 | $2,108 | $96,311 | $38,500 | $57,811 |
| 2024 | $1,952 | $96,311 | $38,500 | $57,811 |
| 2023 | $1,952 | $88,019 | $33,250 | $54,769 |
| 2022 | $1,808 | $76,453 | $26,250 | $50,203 |
| 2021 | $1,674 | $72,311 | $24,500 | $47,811 |
| 2020 | $1,552 | $72,000 | $24,500 | $47,500 |
| 2019 | $1,454 | $68,329 | $21,350 | $46,979 |
| 2018 | $1,388 | $62,391 | $17,150 | $45,241 |
| 2017 | $1,818 | $61,999 | $16,100 | $45,899 |
| 2016 | $1,300 | $58,644 | $12,600 | $46,044 |
| 2015 | $1,296 | $45,410 | $9,450 | $35,960 |
| 2014 | -- | $41,634 | $7,350 | $34,284 |
Source: Public Records
Map
Nearby Homes
- 9154 W Naples Dr
- 4536 Grandspur St
- 4512 Long Horse Ct
- 9096 Heavenly Valley Ave
- 9123 Scallop Reef Ave
- 9037 Alpine Peaks Ave
- 8960 Lansberry Ct
- 8983 Odense Way
- 4607 El Camino Cabos Dr
- 9024 Alpine Peaks Ave
- 8911 Lansberry Ct
- 8880 Flat Sands Ct
- 4678 El Camino Cabos Dr
- 4680 Laguna Vista St
- 4326 Spooner Lake Cir
- 9463 Malasana Ct
- 9050 W Tropicana Ave Unit 1107
- 9050 W Tropicana Ave Unit 1073
- 9050 W Tropicana Ave Unit 1086
- 9050 W Tropicana Ave Unit 1066
- 9149 Riding Heights Ave
- 9137 Riding Heights Ave
- 9131 Riding Heights Ave
- 9155 Riding Heights Ave
- 9142 W Naples Dr
- 9148 W Naples Dr
- 9136 W Naples Dr
- 9161 Riding Heights Ave
- 9125 Riding Heights Ave
- 4560 Grandspur St
- 9130 W Naples Dr
- 4561 Long Horse Ct
- 9160 W Naples Dr
- 9124 W Naples Dr
- 9119 Riding Heights Ave
- 9167 Riding Heights Ave
- 4552 Grandspur St
- 4553 Long Horse Ct
- 4553 Long Horse Ct Unit n/a
- 9118 W Naples Dr