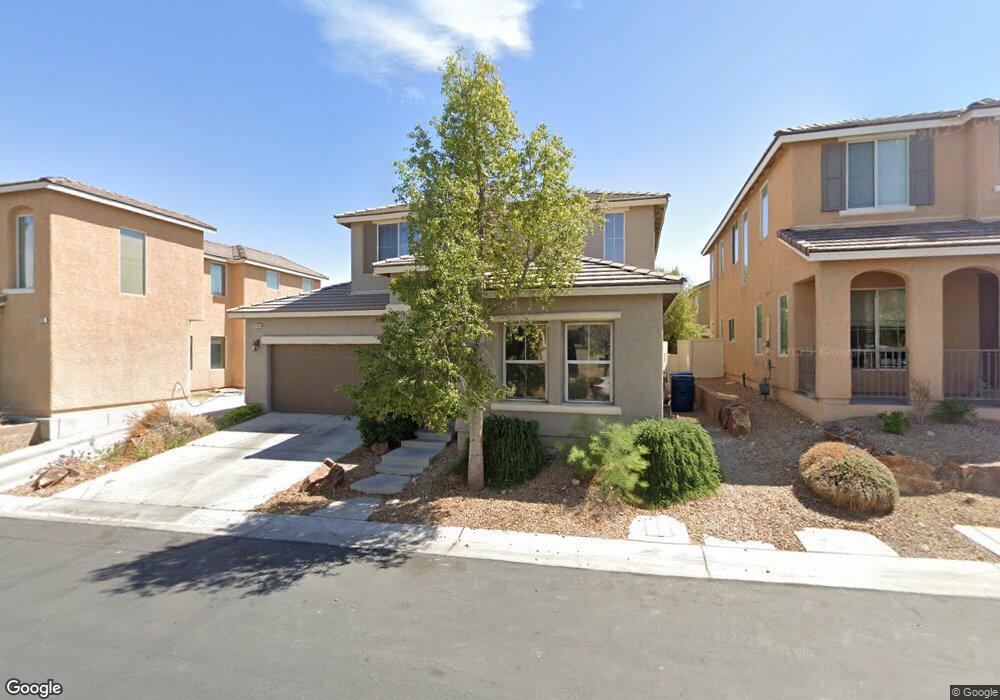
9143 W Brilliant Prairie Ct Las Vegas, NV 89149
Estimated Value: $432,000 - $472,000
4
Beds
3
Baths
2,056
Sq Ft
$217/Sq Ft
Est. Value
About This Home
This home is located at 9143 W Brilliant Prairie Ct, Las Vegas, NV 89149 and is currently estimated at $446,715, approximately $217 per square foot. 9143 W Brilliant Prairie Ct is a home located in Clark County with nearby schools including Marshall C. Darnell Elementary School, Edmundo "Eddie" Escobedo, Sr. Middle School, and Centennial High School.
Ownership History
Date
Name
Owned For
Owner Type
Purchase Details
Closed on
Aug 19, 2020
Sold by
Top Ocean Inc
Bought by
Silva Jorge Luis Caballero and Caballero Carolin Gessel
Current Estimated Value
Home Financials for this Owner
Home Financials are based on the most recent Mortgage that was taken out on this home.
Original Mortgage
$299,475
Outstanding Balance
$264,457
Interest Rate
3%
Mortgage Type
FHA
Estimated Equity
$182,258
Purchase Details
Closed on
Sep 15, 2011
Sold by
Herrera Celeste
Bought by
Top Ocean Inc
Purchase Details
Closed on
Jun 28, 2006
Sold by
Richmond American Homes Of Nevada Inc
Bought by
Herrera Celeste
Home Financials for this Owner
Home Financials are based on the most recent Mortgage that was taken out on this home.
Original Mortgage
$263,881
Interest Rate
7%
Mortgage Type
Unknown
Create a Home Valuation Report for This Property
The Home Valuation Report is an in-depth analysis detailing your home's value as well as a comparison with similar homes in the area
Home Values in the Area
Average Home Value in this Area
Purchase History
| Date | Buyer | Sale Price | Title Company |
|---|---|---|---|
| Silva Jorge Luis Caballero | $305,000 | Stewart Title Company | |
| Top Ocean Inc | $106,100 | None Available | |
| Herrera Celeste | $329,852 | Stewart Title Of Nevada |
Source: Public Records
Mortgage History
| Date | Status | Borrower | Loan Amount |
|---|---|---|---|
| Open | Silva Jorge Luis Caballero | $299,475 | |
| Previous Owner | Herrera Celeste | $263,881 |
Source: Public Records
Tax History Compared to Growth
Tax History
| Year | Tax Paid | Tax Assessment Tax Assessment Total Assessment is a certain percentage of the fair market value that is determined by local assessors to be the total taxable value of land and additions on the property. | Land | Improvement |
|---|---|---|---|---|
| 2025 | $1,729 | $123,076 | $33,600 | $89,476 |
| 2024 | $1,679 | $123,076 | $33,600 | $89,476 |
| 2023 | $1,285 | $117,303 | $32,900 | $84,403 |
| 2022 | $1,787 | $103,406 | $26,600 | $76,806 |
| 2021 | $1,655 | $97,464 | $24,500 | $72,964 |
| 2020 | $1,534 | $96,708 | $24,500 | $72,208 |
| 2019 | $1,438 | $91,142 | $20,300 | $70,842 |
| 2018 | $1,372 | $84,245 | $16,450 | $67,795 |
| 2017 | $2,094 | $76,806 | $15,050 | $61,756 |
| 2016 | $1,285 | $61,405 | $11,550 | $49,855 |
| 2015 | $1,282 | $47,335 | $7,000 | $40,335 |
| 2014 | $1,242 | $44,186 | $5,250 | $38,936 |
Source: Public Records
Map
Nearby Homes
- 6324 Zephyr Peak Ct
- 6348 Zephyr Peak Ct
- 6312 Zephyr Peak Ct
- 6619 Salt Pond Bay St
- 6617 Breakwater Reef St
- 6230 Calm Brook Ct
- 6196 Serenity Bluffs St
- 6630 Rocky Reef St
- 8925 Silent Brook Ct
- 8888 Steven Chase Ct
- 6749 Browns Bay Ct
- 9148 Patrick Henry Ave
- 6315 N El Capitan Way
- 0 N Miller Unit 2686157
- 5889 N Shaumber Rd
- 0 Tropical Pkwy Unit 2720666
- 0 N Miller Unit 2686151
- 6758 Barrington Hills St
- 5975 N El Capitan Way
- 6749 Barrington Hills St
- 9143 Brilliant Prairie Ct
- 9151 Brilliant Prairie Ct
- 9135 Brilliant Prairie Ct
- 9159 Brilliant Prairie Ct
- 9144 Beautiful Flower Ct
- 9152 Beautiful Flower Ct
- 9136 Beautiful Flower Ct
- 9127 Brilliant Prairie Ct
- 9142 Brilliant Prairie Ct
- 9160 Beautiful Flower Ct
- 9150 Brilliant Prairie Ct
- 9150 Brilliant Prairie Ct Unit 1
- 9128 Beautiful Flower Ct
- 9134 Brilliant Prairie Ct
- 9167 Brilliant Prairie Ct
- 9158 Brilliant Prairie Ct
- 9126 Brilliant Prairie Ct
- 9168 Beautiful Flower Ct
- 9120 Beautiful Flower Ct
- 9166 Brilliant Prairie Ct