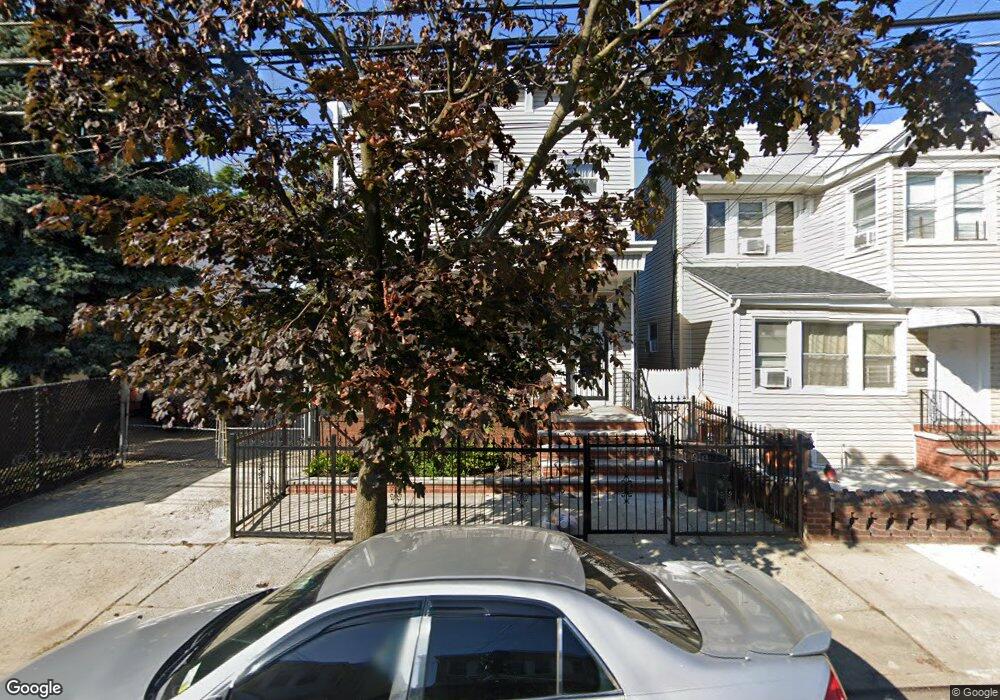
9144 86th St Woodhaven, NY 11421
Woodhaven NeighborhoodEstimated Value: $840,015 - $1,138,000
--
Bed
--
Bath
1,920
Sq Ft
$492/Sq Ft
Est. Value
About This Home
This home is located at 9144 86th St, Woodhaven, NY 11421 and is currently estimated at $945,254, approximately $492 per square foot. 9144 86th St is a home located in Queens County with nearby schools including P.S. 060 Woodhaven, Jhs 210 Elizabeth Blackwell, and St. Thomas the Apostle Catholic Academy.
Ownership History
Date
Name
Owned For
Owner Type
Purchase Details
Closed on
Aug 14, 2003
Sold by
Seiler Jerome
Bought by
Seiler John and Seiler Mollie
Current Estimated Value
Purchase Details
Closed on
Dec 28, 1998
Sold by
Seiler June
Bought by
Seiler Jerome and Seiler John
Home Financials for this Owner
Home Financials are based on the most recent Mortgage that was taken out on this home.
Original Mortgage
$25,170
Interest Rate
6.74%
Create a Home Valuation Report for This Property
The Home Valuation Report is an in-depth analysis detailing your home's value as well as a comparison with similar homes in the area
Home Values in the Area
Average Home Value in this Area
Purchase History
| Date | Buyer | Sale Price | Title Company |
|---|---|---|---|
| Seiler John | -- | -- | |
| Seiler John | -- | -- | |
| Seiler Jerome | -- | Boundary Title Services Inc | |
| Seiler Jerome | -- | Boundary Title Services Inc |
Source: Public Records
Mortgage History
| Date | Status | Borrower | Loan Amount |
|---|---|---|---|
| Closed | Seiler Jerome | $25,170 |
Source: Public Records
Tax History Compared to Growth
Tax History
| Year | Tax Paid | Tax Assessment Tax Assessment Total Assessment is a certain percentage of the fair market value that is determined by local assessors to be the total taxable value of land and additions on the property. | Land | Improvement |
|---|---|---|---|---|
| 2025 | $7,952 | $42,422 | $12,490 | $29,932 |
| 2024 | $7,964 | $40,993 | $13,952 | $27,041 |
| 2023 | $7,487 | $38,675 | $12,542 | $26,133 |
| 2022 | $7,303 | $50,760 | $16,500 | $34,260 |
| 2021 | $7,590 | $42,060 | $16,500 | $25,560 |
| 2020 | $7,187 | $46,260 | $16,500 | $29,760 |
| 2019 | $6,853 | $44,280 | $16,500 | $27,780 |
| 2018 | $6,272 | $32,229 | $12,698 | $19,531 |
| 2017 | $6,159 | $31,683 | $14,473 | $17,210 |
| 2016 | $5,933 | $31,683 | $14,473 | $17,210 |
| 2015 | $3,385 | $29,460 | $18,300 | $11,160 |
| 2014 | $3,385 | $28,468 | $18,241 | $10,227 |
Source: Public Records
Map
Nearby Homes