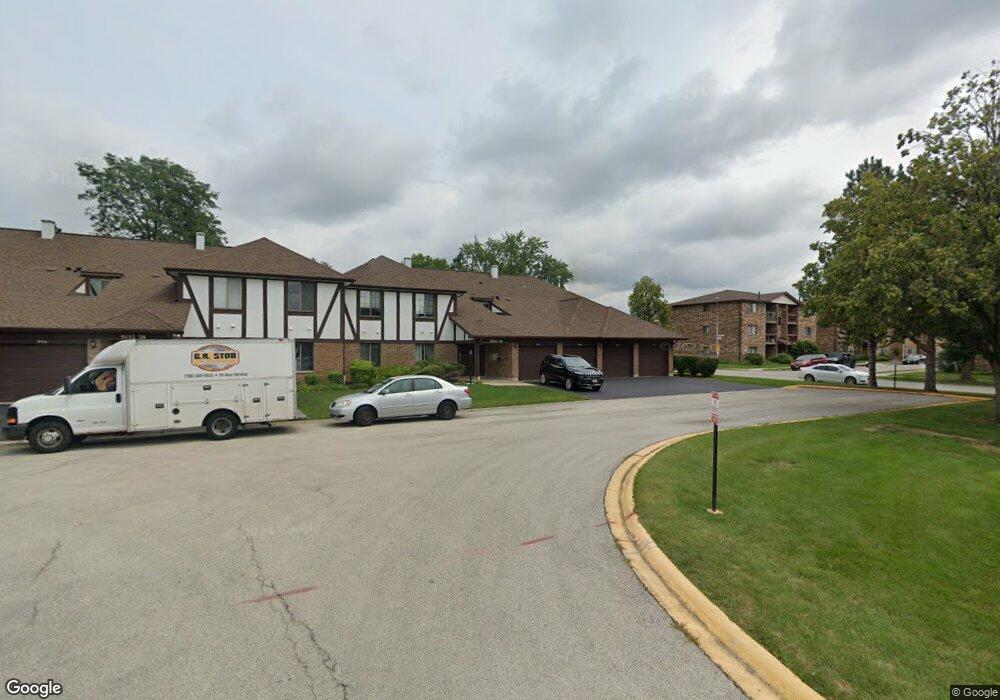
9146 Clairmont Ct Unit 119 Orland Park, IL 60462
Central Orland NeighborhoodEstimated Value: $215,000 - $262,000
2
Beds
2
Baths
1,250
Sq Ft
$190/Sq Ft
Est. Value
About This Home
This home is located at 9146 Clairmont Ct Unit 119, Orland Park, IL 60462 and is currently estimated at $237,998, approximately $190 per square foot. 9146 Clairmont Ct Unit 119 is a home located in Cook County with nearby schools including Prairie Elementary School, Liberty Elementary School, and Jerling Junior High School.
Ownership History
Date
Name
Owned For
Owner Type
Purchase Details
Closed on
Jul 27, 2011
Sold by
Household Finance Corporation Iii
Bought by
Kaluza Iwona E
Current Estimated Value
Home Financials for this Owner
Home Financials are based on the most recent Mortgage that was taken out on this home.
Original Mortgage
$70,400
Outstanding Balance
$48,699
Interest Rate
4.55%
Mortgage Type
New Conventional
Estimated Equity
$189,299
Purchase Details
Closed on
Feb 14, 2011
Sold by
Mitrovic Milan and Mitrovic Luca
Bought by
Household Finance Corporation Iii
Purchase Details
Closed on
Sep 30, 2002
Sold by
Wojnarowski Steven M
Bought by
Mitrovic Milan and Mitrovic Luca
Home Financials for this Owner
Home Financials are based on the most recent Mortgage that was taken out on this home.
Original Mortgage
$123,500
Interest Rate
6.39%
Create a Home Valuation Report for This Property
The Home Valuation Report is an in-depth analysis detailing your home's value as well as a comparison with similar homes in the area
Home Values in the Area
Average Home Value in this Area
Purchase History
| Date | Buyer | Sale Price | Title Company |
|---|---|---|---|
| Kaluza Iwona E | $88,000 | Premier Title | |
| Household Finance Corporation Iii | -- | Premier Title | |
| Mitrovic Milan | $130,000 | Ticor Title Insurance Compan |
Source: Public Records
Mortgage History
| Date | Status | Borrower | Loan Amount |
|---|---|---|---|
| Open | Kaluza Iwona E | $70,400 | |
| Previous Owner | Mitrovic Milan | $123,500 |
Source: Public Records
Tax History Compared to Growth
Tax History
| Year | Tax Paid | Tax Assessment Tax Assessment Total Assessment is a certain percentage of the fair market value that is determined by local assessors to be the total taxable value of land and additions on the property. | Land | Improvement |
|---|---|---|---|---|
| 2024 | $3,312 | $16,550 | $2,356 | $14,194 |
| 2023 | $2,895 | $16,550 | $2,356 | $14,194 |
| 2022 | $2,895 | $13,085 | $2,074 | $11,011 |
| 2021 | $2,822 | $13,083 | $2,073 | $11,010 |
| 2020 | $2,779 | $13,083 | $2,073 | $11,010 |
| 2019 | $2,460 | $12,392 | $1,885 | $10,507 |
| 2018 | $2,391 | $12,392 | $1,885 | $10,507 |
| 2017 | $2,353 | $12,392 | $1,885 | $10,507 |
| 2016 | $2,283 | $10,680 | $1,696 | $8,984 |
| 2015 | $2,227 | $10,680 | $1,696 | $8,984 |
| 2014 | $2,208 | $10,680 | $1,696 | $8,984 |
| 2013 | $2,587 | $12,724 | $1,696 | $11,028 |
Source: Public Records
Map
Nearby Homes
- 9148 Clairmont Ct Unit 120
- 14759 Montgomery Dr
- 14746 Lakeview Dr
- 8944 Fernwood Ct
- 9205 Lake View Dr
- 9048 W 147th St
- 9061 Somerset Ct Unit 16
- 9055 Fairway Dr
- 14641 Birch St
- 14739 Maple Ave
- 14610 Birch St
- 14602 Beech St
- 14656 Green St
- 14540 Birch St
- 9180 136th St
- 56 Orland Square Dr
- 14712 S 88th Ave
- 14440 Brentwood St
- 14402 S 90th Ct Unit 1A
- 14350 Mason Ln
- 9146 Clairmont Ct Unit 9146
- 9142 Clairmont Ct Unit 117
- 9142 Clairmont Ct Unit 9142
- 9142 Clairmont Ct Unit 1
- 9152 Clairmont Ct Unit 121
- 9144 Clairmont Ct Unit 118
- 9154 Clairmont Ct Unit 122
- 9156 Clairmont Ct Unit 123
- 9156 Clairmont Ct Unit 9156
- 9156 Clairmont Ct Unit 2E
- 9158 Clairmont Ct Unit 124
- 9158 Clairmont Ct Unit 9158
- 9138 Clairmont Ct Unit 116
- 9136 Clairmont Ct Unit 115
- 9164 Clairmont Ct Unit 126
- 9164 Clairmont Ct Unit 125
- 9141 Greencastle Ln
- 9145 Greencastle Ln
- 9149 Greencastle Ln
- 9137 Greencastle Ln