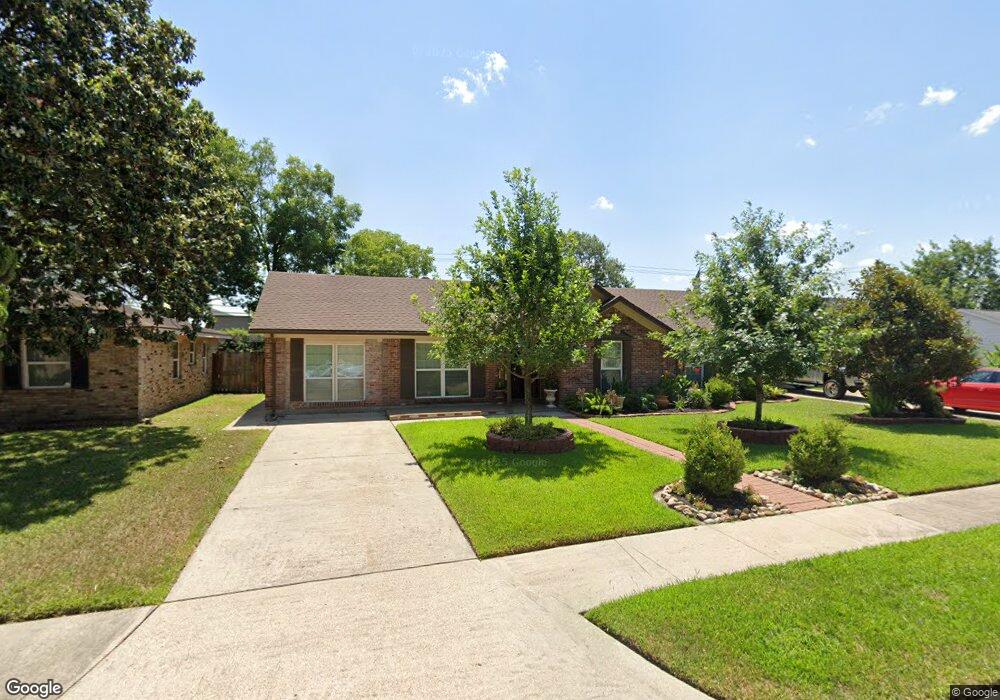
9146 Sunnywood Dr Houston, TX 77088
Hidden Valley NeighborhoodEstimated Value: $217,910 - $231,000
3
Beds
2
Baths
1,564
Sq Ft
$145/Sq Ft
Est. Value
About This Home
This home is located at 9146 Sunnywood Dr, Houston, TX 77088 and is currently estimated at $226,978, approximately $145 per square foot. 9146 Sunnywood Dr is a home located in Harris County with nearby schools including Jerry Keeble Ec/Pre-K, Goodman Elementary School, and Aldine Ninth Grade School.
Ownership History
Date
Name
Owned For
Owner Type
Purchase Details
Closed on
Sep 26, 2013
Sold by
Almaraz Savinyn
Bought by
Almaraz Svinyn
Current Estimated Value
Home Financials for this Owner
Home Financials are based on the most recent Mortgage that was taken out on this home.
Original Mortgage
$96,900
Outstanding Balance
$25,723
Interest Rate
4.62%
Mortgage Type
New Conventional
Estimated Equity
$201,255
Purchase Details
Closed on
Aug 6, 2007
Sold by
Mendoza Jose L and Mendoza Jose Luis
Bought by
Almaraz Svinyn
Home Financials for this Owner
Home Financials are based on the most recent Mortgage that was taken out on this home.
Original Mortgage
$104,000
Interest Rate
6.72%
Mortgage Type
Purchase Money Mortgage
Purchase Details
Closed on
Jan 20, 1999
Sold by
Ford Patricia Kaye Jones
Bought by
Mendoza Jose L
Home Financials for this Owner
Home Financials are based on the most recent Mortgage that was taken out on this home.
Original Mortgage
$59,850
Interest Rate
6.66%
Create a Home Valuation Report for This Property
The Home Valuation Report is an in-depth analysis detailing your home's value as well as a comparison with similar homes in the area
Home Values in the Area
Average Home Value in this Area
Purchase History
| Date | Buyer | Sale Price | Title Company |
|---|---|---|---|
| Almaraz Svinyn | -- | None Available | |
| Almaraz Svinyn | -- | None Available | |
| Mendoza Jose L | -- | First American Title |
Source: Public Records
Mortgage History
| Date | Status | Borrower | Loan Amount |
|---|---|---|---|
| Open | Almaraz Svinyn | $96,900 | |
| Previous Owner | Almaraz Svinyn | $104,000 | |
| Previous Owner | Mendoza Jose L | $59,850 |
Source: Public Records
Tax History Compared to Growth
Tax History
| Year | Tax Paid | Tax Assessment Tax Assessment Total Assessment is a certain percentage of the fair market value that is determined by local assessors to be the total taxable value of land and additions on the property. | Land | Improvement |
|---|---|---|---|---|
| 2025 | $2,390 | $181,412 | $56,696 | $124,716 |
| 2024 | $2,390 | $175,086 | $40,497 | $134,589 |
| 2023 | $2,390 | $179,434 | $40,497 | $138,937 |
| 2022 | $3,335 | $145,469 | $35,215 | $110,254 |
| 2021 | $3,175 | $126,383 | $19,368 | $107,015 |
| 2020 | $3,336 | $126,383 | $19,368 | $107,015 |
| 2019 | $3,189 | $115,528 | $19,121 | $96,407 |
| 2018 | $1,145 | $111,287 | $19,121 | $92,166 |
| 2017 | $2,526 | $111,287 | $19,121 | $92,166 |
| 2016 | $2,297 | $97,156 | $19,121 | $78,035 |
| 2015 | $1,524 | $91,932 | $19,121 | $72,811 |
| 2014 | $1,524 | $83,732 | $19,121 | $64,611 |
Source: Public Records
Map
Nearby Homes
- 9022 Indian River Dr
- 9018 Lazy River Ln
- 1011 Beaver Bend Rd
- 9006 Winding River Dr
- 619 Rocky Mountain Dr
- 619 Rainy River Dr
- 907 Twin Falls Rd
- 1102 Mosher Ln
- 1307 Saddle Rock Dr
- 1119 Twin Falls Rd
- 954 W Bertrand St
- 8718 Glen Shadow Dr
- 1330 Mosher Ln
- 9207 Cobbleshire Dr
- 1314 Tarberry Rd
- 1326 Twin Falls Rd
- 9231 Rockcliff Dr
- 1615 Mosher Ln
- 9621 Sweetwater Ln
- 1710 Beaver Bend Rd
- 9142 Sunnywood Dr
- 9150 Sunnywood Dr
- 9138 Sunnywood Dr
- 9154 Sunnywood Dr
- 802 Rocky Mount Dr
- 803 Hidden Valley Dr
- 806 Rocky Mount Dr
- 807 Hidden Valley Dr
- 9202 Sunnywood Dr
- 807 Rocky Mount Dr
- 810 Rocky Mount Dr
- 811 Hidden Valley Dr
- 802 Hidden Valley Dr
- 9206 Sunnywood Dr
- 806 Hidden Valley Dr
- 814 Rocky Mount Dr
- 815 Hidden Valley Dr
- 9126 Sunnywood Dr
- 810 Hidden Valley Dr
- 9210 Sunnywood Dr