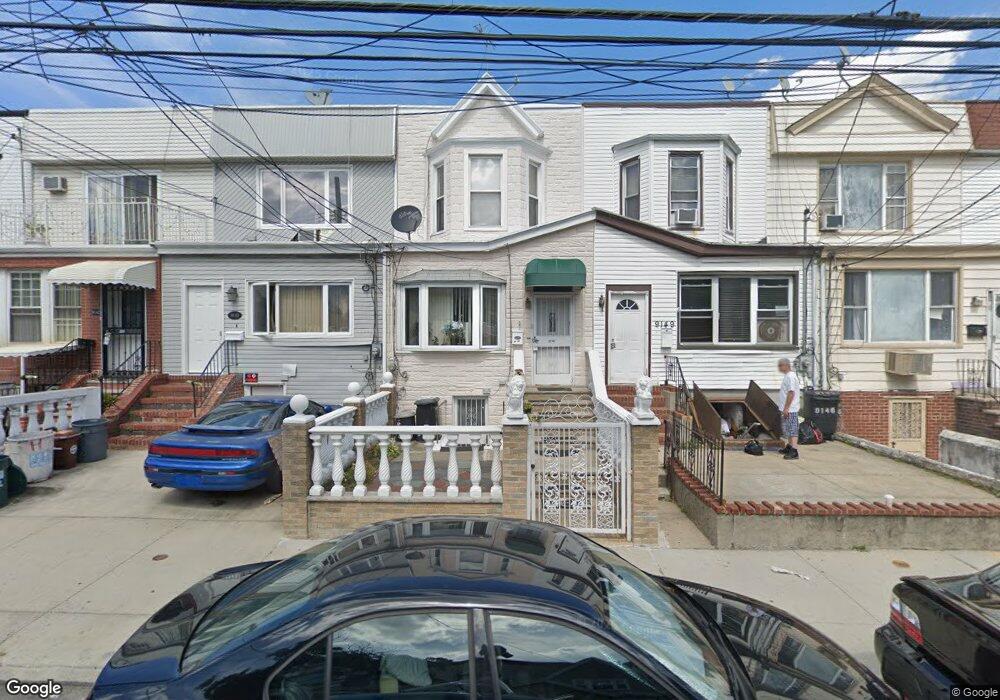
9147 88th St Woodhaven, NY 11421
Woodhaven NeighborhoodEstimated Value: $664,000 - $742,000
--
Bed
--
Bath
1,152
Sq Ft
$615/Sq Ft
Est. Value
About This Home
This home is located at 9147 88th St, Woodhaven, NY 11421 and is currently estimated at $708,893, approximately $615 per square foot. 9147 88th St is a home located in Queens County with nearby schools including New York City Academy For Discovery, Jhs 210 Elizabeth Blackwell, and St. Thomas the Apostle Catholic Academy.
Ownership History
Date
Name
Owned For
Owner Type
Purchase Details
Closed on
Dec 9, 2016
Sold by
Marrasquin April and Marrasquin Victor
Bought by
Akter Rabia and Basher Akm
Current Estimated Value
Home Financials for this Owner
Home Financials are based on the most recent Mortgage that was taken out on this home.
Original Mortgage
$376,000
Outstanding Balance
$306,711
Interest Rate
3.94%
Mortgage Type
New Conventional
Estimated Equity
$402,182
Purchase Details
Closed on
Feb 4, 2005
Sold by
Marrasquin April and Marrasquin Josefa
Bought by
Marrasquin April and Marrasquin Victory
Purchase Details
Closed on
Sep 23, 2002
Sold by
Tomas Cristian and Tomas Monica
Bought by
Marrasquin Victor and Marrasquin April
Home Financials for this Owner
Home Financials are based on the most recent Mortgage that was taken out on this home.
Original Mortgage
$272,650
Interest Rate
6.07%
Create a Home Valuation Report for This Property
The Home Valuation Report is an in-depth analysis detailing your home's value as well as a comparison with similar homes in the area
Home Values in the Area
Average Home Value in this Area
Purchase History
| Date | Buyer | Sale Price | Title Company |
|---|---|---|---|
| Akter Rabia | $470,000 | -- | |
| Akter Rabia | $470,000 | -- | |
| Marrasquin April | -- | -- | |
| Marrasquin April | -- | -- | |
| Marrasquin Victor | -- | -- | |
| Marrasquin Victor | -- | -- |
Source: Public Records
Mortgage History
| Date | Status | Borrower | Loan Amount |
|---|---|---|---|
| Open | Akter Rabia | $376,000 | |
| Closed | Akter Rabia | $376,000 | |
| Previous Owner | Marrasquin Victor | $272,650 | |
| Closed | Marrasquin April | $0 |
Source: Public Records
Tax History Compared to Growth
Tax History
| Year | Tax Paid | Tax Assessment Tax Assessment Total Assessment is a certain percentage of the fair market value that is determined by local assessors to be the total taxable value of land and additions on the property. | Land | Improvement |
|---|---|---|---|---|
| 2025 | $4,985 | $26,307 | $7,284 | $19,023 |
| 2024 | $4,985 | $24,818 | $6,686 | $18,132 |
| 2023 | $4,703 | $23,414 | $6,420 | $16,994 |
| 2022 | $4,635 | $36,360 | $10,200 | $26,160 |
| 2021 | $4,886 | $32,520 | $10,200 | $22,320 |
| 2020 | $4,640 | $34,920 | $10,200 | $24,720 |
| 2019 | $4,327 | $30,720 | $10,200 | $20,520 |
| 2018 | $3,978 | $19,512 | $6,910 | $12,602 |
| 2017 | $3,644 | $19,347 | $6,924 | $12,423 |
| 2016 | $3,558 | $19,347 | $6,924 | $12,423 |
| 2015 | $1,982 | $18,269 | $10,155 | $8,114 |
| 2014 | $1,982 | $17,235 | $10,023 | $7,212 |
Source: Public Records
Map
Nearby Homes