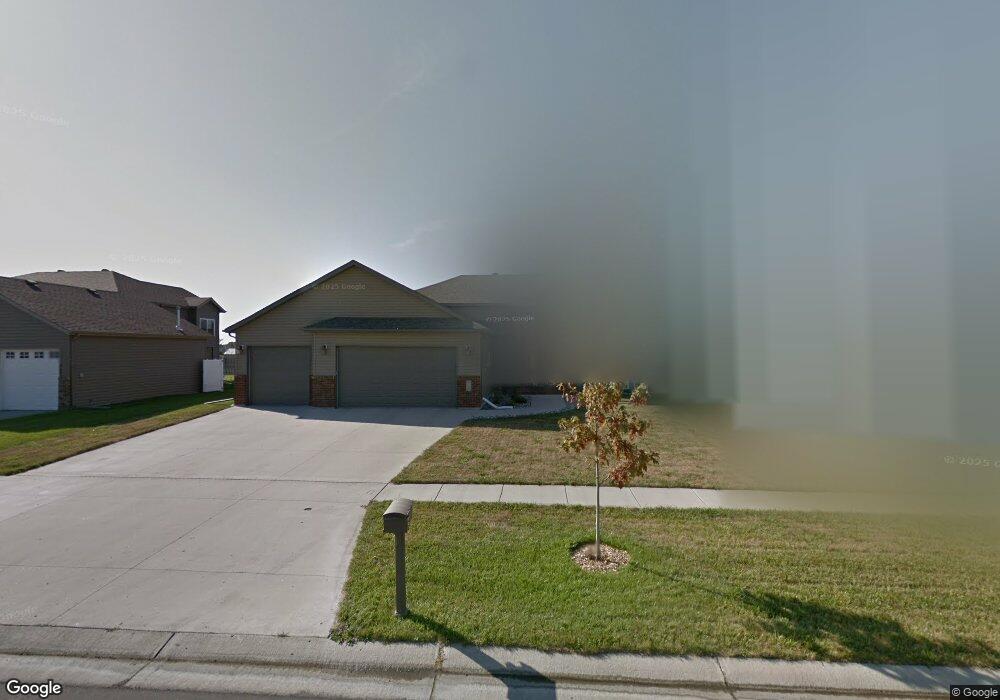
915 36th Ave W West Fargo, ND 58078
Eagle Run NeighborhoodEstimated Value: $397,000
4
Beds
3
Baths
2,734
Sq Ft
$145/Sq Ft
Est. Value
About This Home
This home is located at 915 36th Ave W, West Fargo, ND 58078 and is currently estimated at $397,000, approximately $145 per square foot. 915 36th Ave W is a home located in Cass County with nearby schools including Aurora Elementary School, Liberty Middle School, and West Fargo Sheyenne High School.
Ownership History
Date
Name
Owned For
Owner Type
Purchase Details
Closed on
Jul 17, 2020
Sold by
Ystenes Cory James and Ystenes Gina Marie
Bought by
Bunkowski Joseph C and Bunkowski Kayla J
Current Estimated Value
Home Financials for this Owner
Home Financials are based on the most recent Mortgage that was taken out on this home.
Original Mortgage
$372,000
Outstanding Balance
$326,064
Interest Rate
2.5%
Mortgage Type
New Conventional
Estimated Equity
$70,936
Purchase Details
Closed on
Oct 11, 2019
Sold by
Ystenes Cory James and Ystenes Gina Marie
Bought by
Ystenes Cory James and Ystenes Gina Marie
Purchase Details
Closed on
Apr 15, 2016
Sold by
Sjulstad Johnson Jason R and Sjulstad Johnson Breanne
Bought by
Ystenes Cory and Ystenes Gina
Home Financials for this Owner
Home Financials are based on the most recent Mortgage that was taken out on this home.
Original Mortgage
$271,800
Interest Rate
2.37%
Mortgage Type
Adjustable Rate Mortgage/ARM
Purchase Details
Closed on
Apr 4, 2013
Sold by
Alberts Kristopher D and Alberts Suzanne M
Bought by
Sjulstad Johnson Jason R and Sjulstad Johnson Breanne
Home Financials for this Owner
Home Financials are based on the most recent Mortgage that was taken out on this home.
Original Mortgage
$204,400
Interest Rate
3.52%
Mortgage Type
New Conventional
Purchase Details
Closed on
May 12, 2006
Sold by
Rhr Construction Inc
Bought by
Alberts Kristopher D and Alberts Suzanne M
Home Financials for this Owner
Home Financials are based on the most recent Mortgage that was taken out on this home.
Original Mortgage
$155,900
Interest Rate
6.39%
Mortgage Type
New Conventional
Purchase Details
Closed on
May 11, 2006
Sold by
Eagle Run 13Th Llc
Bought by
Rhr Construction Inc
Home Financials for this Owner
Home Financials are based on the most recent Mortgage that was taken out on this home.
Original Mortgage
$155,900
Interest Rate
6.39%
Mortgage Type
New Conventional
Create a Home Valuation Report for This Property
The Home Valuation Report is an in-depth analysis detailing your home's value as well as a comparison with similar homes in the area
Home Values in the Area
Average Home Value in this Area
Purchase History
| Date | Buyer | Sale Price | Title Company |
|---|---|---|---|
| Bunkowski Joseph C | $340,000 | Title Company Residential | |
| Ystenes Cory James | -- | None Available | |
| Ystenes Cory | $320,000 | Title Co | |
| Sjulstad Johnson Jason R | $255,500 | Fm Title | |
| Alberts Kristopher D | $194,900 | -- | |
| Rhr Construction Inc | -- | -- |
Source: Public Records
Mortgage History
| Date | Status | Borrower | Loan Amount |
|---|---|---|---|
| Open | Bunkowski Joseph C | $372,000 | |
| Previous Owner | Ystenes Cory | $271,800 | |
| Previous Owner | Sjulstad Johnson Jason R | $204,400 | |
| Previous Owner | Alberts Kristopher D | $155,900 |
Source: Public Records
Tax History Compared to Growth
Tax History
| Year | Tax Paid | Tax Assessment Tax Assessment Total Assessment is a certain percentage of the fair market value that is determined by local assessors to be the total taxable value of land and additions on the property. | Land | Improvement |
|---|---|---|---|---|
| 2024 | $5,259 | $200,200 | $30,000 | $170,200 |
| 2023 | $5,562 | $192,400 | $30,000 | $162,400 |
| 2022 | $5,248 | $177,350 | $30,000 | $147,350 |
| 2021 | $4,962 | $165,150 | $24,000 | $141,150 |
| 2020 | $4,689 | $158,300 | $24,000 | $134,300 |
| 2019 | $5,569 | $153,100 | $24,000 | $129,100 |
| 2018 | $6,144 | $156,050 | $24,000 | $132,050 |
| 2017 | $6,083 | $157,500 | $24,000 | $133,500 |
| 2016 | $5,637 | $152,300 | $24,000 | $128,300 |
| 2015 | $5,384 | $129,300 | $12,600 | $116,700 |
| 2014 | $5,407 | $120,850 | $12,600 | $108,250 |
| 2013 | $5,408 | $117,650 | $14,550 | $103,100 |
Source: Public Records
Map
Nearby Homes
- 3662 N Sedona Ct
- 1040 39th Ave W
- 909 38 1 2 Ave W
- 945 31st Ave W
- 1054 42nd Ave W
- 922 31st Ave W
- 1156 42nd Ave W Unit A
- 360 32nd Ave W Unit 608
- 360 32nd Ave W Unit 508
- 1236 S Beach Way
- 1168 43rd Ave W
- 1015 29th Ave W
- 1381 Westport Beach Way
- 939 Eaglewood Ave
- 3371 1st St
- 4507 Newport Ln
- 4509 11th St W
- 4534 Westport Pkwy
- 3037 Claire Dr E
- 2733 Divide St W