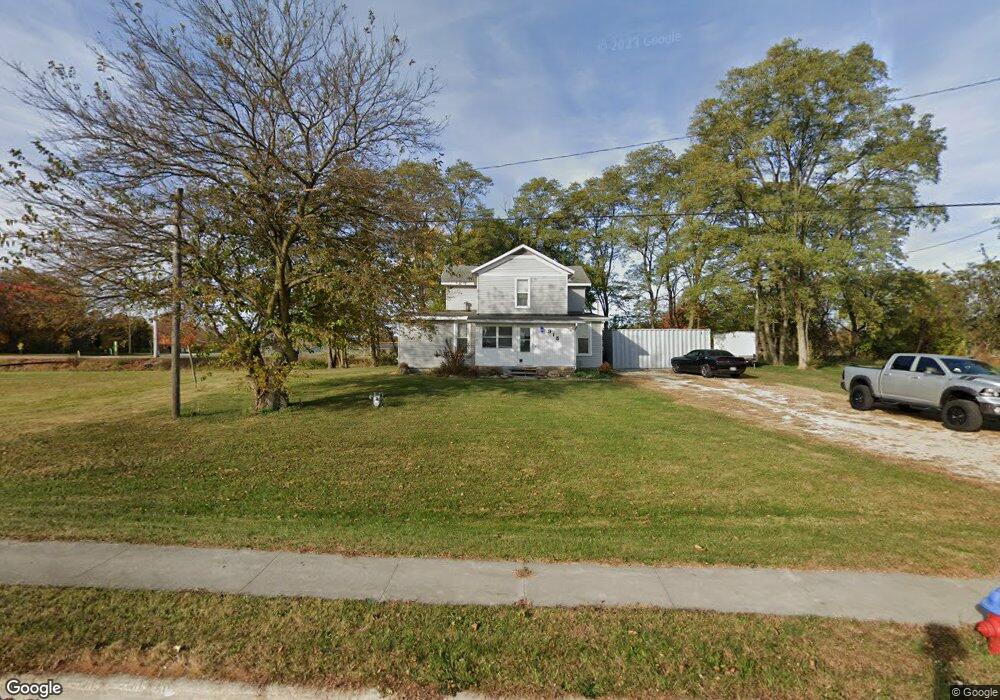
915 Beech St Saint Marys, OH 45885
Estimated Value: $167,952 - $248,000
2
Beds
1
Bath
1,876
Sq Ft
$111/Sq Ft
Est. Value
About This Home
This home is located at 915 Beech St, Saint Marys, OH 45885 and is currently estimated at $208,988, approximately $111 per square foot. 915 Beech St is a home located in Auglaize County with nearby schools including St. Mary's East Primary School, St. Mary's West Intermediate School, and St. Marys Middle School.
Ownership History
Date
Name
Owned For
Owner Type
Purchase Details
Closed on
Jul 17, 2023
Sold by
Rowen Kelly A
Bought by
Rowen James M
Current Estimated Value
Purchase Details
Closed on
Dec 7, 2021
Sold by
Rowen James M and Rowen Kelly Ann
Bought by
Rowen James M and Rowen Kelly Ann
Purchase Details
Closed on
Jul 24, 2009
Sold by
Rowen James T and Rowen Neva S
Bought by
Rowen James M
Home Financials for this Owner
Home Financials are based on the most recent Mortgage that was taken out on this home.
Original Mortgage
$25,000
Interest Rate
5.62%
Mortgage Type
Seller Take Back
Purchase Details
Closed on
May 22, 2009
Sold by
Carpenter Mark A
Bought by
Rowen James T and Rowen Neva S
Purchase Details
Closed on
Dec 14, 1994
Sold by
Bergman David E
Bought by
Carpenter Mark A
Purchase Details
Closed on
Apr 7, 1994
Sold by
Newland Donald W
Bought by
Bergman David E
Purchase Details
Closed on
Feb 1, 1990
Purchase Details
Closed on
Jan 1, 1985
Create a Home Valuation Report for This Property
The Home Valuation Report is an in-depth analysis detailing your home's value as well as a comparison with similar homes in the area
Home Values in the Area
Average Home Value in this Area
Purchase History
| Date | Buyer | Sale Price | Title Company |
|---|---|---|---|
| Rowen James M | -- | None Listed On Document | |
| Rowen James M | -- | None Available | |
| Rowen James M | $25,000 | Attorney | |
| Rowen James T | $25,000 | Attorney | |
| Carpenter Mark A | $34,900 | -- | |
| Bergman David E | $20,000 | -- | |
| -- | $24,000 | -- | |
| -- | $8,000 | -- |
Source: Public Records
Mortgage History
| Date | Status | Borrower | Loan Amount |
|---|---|---|---|
| Previous Owner | Rowen James M | $25,000 |
Source: Public Records
Tax History Compared to Growth
Tax History
| Year | Tax Paid | Tax Assessment Tax Assessment Total Assessment is a certain percentage of the fair market value that is determined by local assessors to be the total taxable value of land and additions on the property. | Land | Improvement |
|---|---|---|---|---|
| 2024 | $2,850 | $40,120 | $7,190 | $32,930 |
| 2023 | $1,485 | $40,120 | $7,190 | $32,930 |
| 2022 | $1,317 | $31,650 | $6,530 | $25,120 |
| 2021 | $1,332 | $31,650 | $6,530 | $25,120 |
| 2020 | $472 | $21,760 | $6,535 | $15,225 |
| 2019 | $808 | $18,344 | $5,509 | $12,835 |
| 2018 | $808 | $18,344 | $5,509 | $12,835 |
| 2017 | $809 | $18,344 | $5,509 | $12,835 |
| 2016 | $808 | $18,361 | $5,166 | $13,195 |
| 2015 | $790 | $18,361 | $5,166 | $13,195 |
| 2014 | $796 | $18,361 | $5,166 | $13,195 |
| 2013 | $823 | $18,361 | $5,166 | $13,195 |
Source: Public Records
Map
Nearby Homes
- 0 S Beech St
- 602 Weston St
- 403 S Vine St
- 408 S Vine St
- 216 Beech St
- 125 Beech St
- 105 Maple St
- 811 Columbia St
- 437 Woodward St
- 1015 Columbia St
- 712 Columbia St
- 911 Cleveland Ave
- 200 N Knoxville Ave Unit 7
- 428 W Spring St
- 520 Oil St
- 508 Webb St
- 220 N Augustus St
- 706 Jackson St
- 313 Concord Ave
- 332 Miami Erie Cir