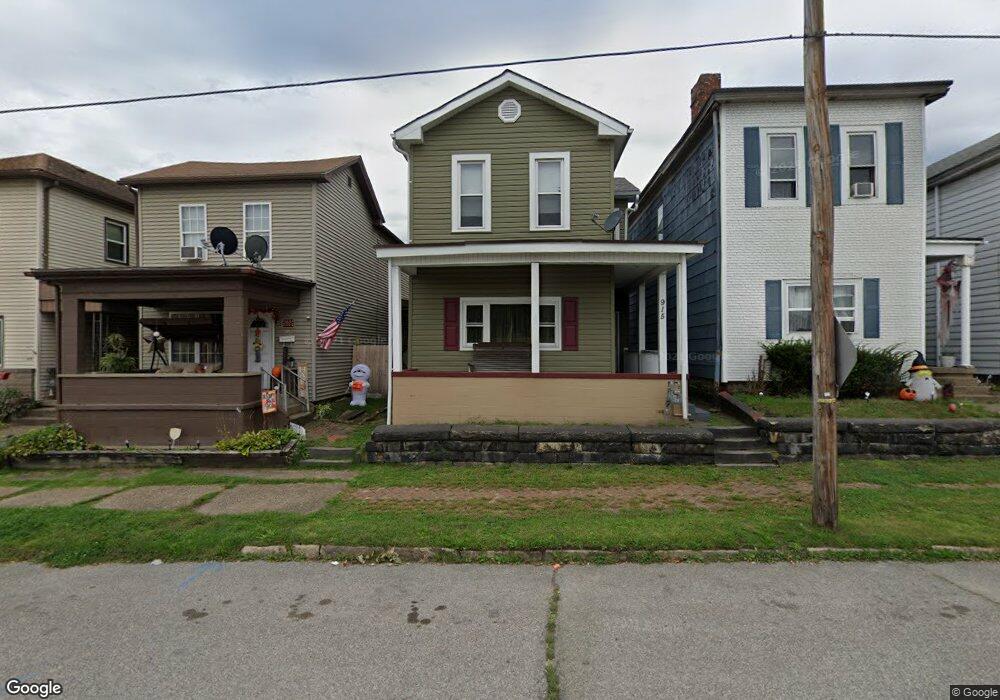
915 Broadway St Martins Ferry, OH 43935
Estimated Value: $110,000 - $166,000
3
Beds
2
Baths
1,840
Sq Ft
$69/Sq Ft
Est. Value
About This Home
This home is located at 915 Broadway St, Martins Ferry, OH 43935 and is currently estimated at $126,566, approximately $68 per square foot. 915 Broadway St is a home located in Belmont County with nearby schools including Anna Marie Ayers Elementary School, Martins Ferry Middle School, and Martins Ferry High School.
Ownership History
Date
Name
Owned For
Owner Type
Purchase Details
Closed on
Apr 15, 2020
Sold by
M N And K Meyer Properties Llc
Bought by
Sanders Georgia and Sanders Neil
Current Estimated Value
Home Financials for this Owner
Home Financials are based on the most recent Mortgage that was taken out on this home.
Original Mortgage
$94,050
Interest Rate
3.2%
Mortgage Type
New Conventional
Purchase Details
Closed on
Apr 24, 2017
Sold by
Meyer Norma
Bought by
M N & K Meyer Properties Llc
Purchase Details
Closed on
Jul 25, 2001
Sold by
Meyer Milo and Surv Norma
Bought by
Meyer Milo and Norma Surv
Purchase Details
Closed on
Jun 5, 2001
Sold by
Meyer Mylo and Surv Norma
Bought by
Meyer Mylo and Norma Surv
Purchase Details
Closed on
Jan 1, 1986
Sold by
Greer Cora F
Bought by
Greer Cora F
Create a Home Valuation Report for This Property
The Home Valuation Report is an in-depth analysis detailing your home's value as well as a comparison with similar homes in the area
Home Values in the Area
Average Home Value in this Area
Purchase History
| Date | Buyer | Sale Price | Title Company |
|---|---|---|---|
| Sanders Georgia | $99,000 | Timios Inc Refi | |
| M N & K Meyer Properties Llc | -- | Attorney | |
| Meyer Milo | -- | -- | |
| Meyer Mylo | $23,000 | -- | |
| Greer Cora F | -- | -- |
Source: Public Records
Mortgage History
| Date | Status | Borrower | Loan Amount |
|---|---|---|---|
| Previous Owner | Sanders Georgia | $94,050 |
Source: Public Records
Tax History Compared to Growth
Tax History
| Year | Tax Paid | Tax Assessment Tax Assessment Total Assessment is a certain percentage of the fair market value that is determined by local assessors to be the total taxable value of land and additions on the property. | Land | Improvement |
|---|---|---|---|---|
| 2024 | $857 | $30,660 | $2,440 | $28,220 |
| 2023 | $447 | $19,130 | $1,990 | $17,140 |
| 2022 | $466 | $19,127 | $1,991 | $17,136 |
| 2021 | $464 | $19,127 | $1,991 | $17,136 |
| 2020 | $817 | $16,630 | $1,730 | $14,900 |
| 2019 | $819 | $16,630 | $1,730 | $14,900 |
| 2018 | $781 | $16,630 | $1,730 | $14,900 |
| 2017 | $634 | $13,020 | $1,780 | $11,240 |
| 2016 | $638 | $13,020 | $1,780 | $11,240 |
| 2015 | $577 | $13,020 | $1,780 | $11,240 |
| 2014 | $553 | $12,320 | $1,620 | $10,700 |
| 2013 | $520 | $12,320 | $1,620 | $10,700 |
Source: Public Records
Map
Nearby Homes