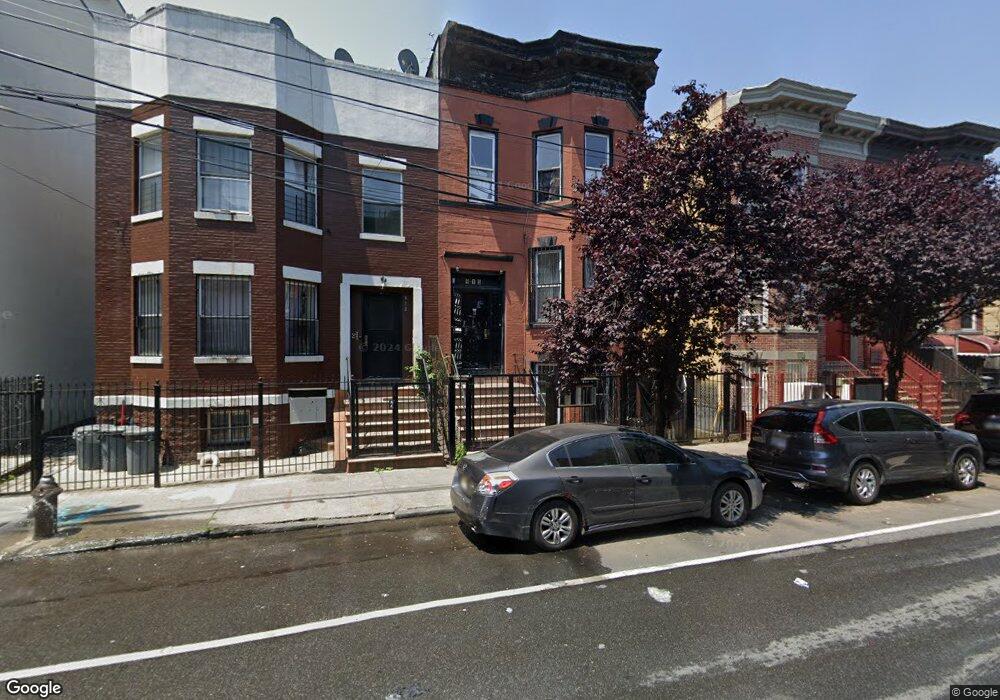
915 Bryant Ave Bronx, NY 10474
Hunts Point NeighborhoodEstimated Value: $915,000 - $1,011,000
--
Bed
--
Bath
3,444
Sq Ft
$279/Sq Ft
Est. Value
About This Home
This home is located at 915 Bryant Ave, Bronx, NY 10474 and is currently estimated at $960,667, approximately $278 per square foot. 915 Bryant Ave is a home located in Bronx County with nearby schools including P.S. 48 - Joseph R. Drake, Bronx Academy for Multi-Media, and Leaders In Our Neighborhood Charter School.
Ownership History
Date
Name
Owned For
Owner Type
Purchase Details
Closed on
Oct 6, 2006
Sold by
Noonan Jonathan
Bought by
Fuller Gwendolyn and Noonan Jonathan
Current Estimated Value
Home Financials for this Owner
Home Financials are based on the most recent Mortgage that was taken out on this home.
Original Mortgage
$464,000
Outstanding Balance
$273,090
Interest Rate
6.4%
Mortgage Type
Purchase Money Mortgage
Estimated Equity
$687,577
Purchase Details
Closed on
Nov 16, 2004
Sold by
Fuller Gwendolyn E
Bought by
Noonan Jonathan
Purchase Details
Closed on
Sep 3, 2003
Sold by
Noonan Charles
Bought by
Fuller Gwendolyn E
Purchase Details
Closed on
Feb 25, 2000
Sold by
Garcia Victor and Garcia Oceana
Bought by
Noonan Charles
Home Financials for this Owner
Home Financials are based on the most recent Mortgage that was taken out on this home.
Original Mortgage
$198,000
Interest Rate
12.25%
Create a Home Valuation Report for This Property
The Home Valuation Report is an in-depth analysis detailing your home's value as well as a comparison with similar homes in the area
Home Values in the Area
Average Home Value in this Area
Purchase History
| Date | Buyer | Sale Price | Title Company |
|---|---|---|---|
| Fuller Gwendolyn | -- | -- | |
| Fuller Gwendolyn | -- | -- | |
| Noonan Jonathan | -- | -- | |
| Noonan Jonathan | -- | -- | |
| Fuller Gwendolyn E | -- | -- | |
| Fuller Gwendolyn E | -- | -- | |
| Noonan Charles | $222,000 | Stewart Title Insurance Co | |
| Noonan Charles | $222,000 | Stewart Title Insurance Co |
Source: Public Records
Mortgage History
| Date | Status | Borrower | Loan Amount |
|---|---|---|---|
| Open | Fuller Gwendolyn | $464,000 | |
| Closed | Fuller Gwendolyn | $464,000 | |
| Previous Owner | Noonan Charles | $198,000 |
Source: Public Records
Tax History Compared to Growth
Tax History
| Year | Tax Paid | Tax Assessment Tax Assessment Total Assessment is a certain percentage of the fair market value that is determined by local assessors to be the total taxable value of land and additions on the property. | Land | Improvement |
|---|---|---|---|---|
| 2025 | $2,216 | $11,176 | $2,423 | $8,753 |
| 2024 | $2,216 | $11,034 | $2,293 | $8,741 |
| 2023 | $2,117 | $10,423 | $1,861 | $8,562 |
| 2022 | $1,967 | $46,560 | $9,900 | $36,660 |
| 2021 | $1,960 | $47,580 | $9,900 | $37,680 |
| 2020 | $1,971 | $43,020 | $9,900 | $33,120 |
| 2019 | $1,924 | $34,680 | $9,900 | $24,780 |
| 2018 | $1,771 | $8,686 | $2,165 | $6,521 |
| 2017 | $1,674 | $8,210 | $2,894 | $5,316 |
| 2016 | $1,551 | $7,761 | $2,350 | $5,411 |
| 2015 | $934 | $7,761 | $2,532 | $5,229 |
| 2014 | $934 | $7,663 | $2,714 | $4,949 |
Source: Public Records
Map
Nearby Homes
- 827 Longfellow Ave
- 950 Hoe Ave Unit 4C
- 950 Hoe Ave Unit 4D
- 1321 Lafayette Ave
- 1012 Faile St Unit 1012A
- 1030 Longfellow Ave
- 1017 Faile St Unit 1017B
- 1032 Longfellow Ave
- 1035 Bryant Ave
- 1047 Faile St Unit 1047A
- 917 Fox St
- 1042 Fox St
- 829 Southern Blvd Unit 3D
- 645 Barretto St Unit 3G
- 1052 Evergreen Ave
- 999 Kelly St
- 1054 Evergreen Ave
- 631 Coster St
- 637 Barretto St
- 633 Barretto St
- 917 Bryant Ave
- 913 Bryant Ave
- 919 Bryant Ave
- 916-918 Faile St
- 1200-1250 Garrison Ave
- 908 Faile St
- 906 Faile St
- 906 Faile St Unit 2
- 912 Bryant Ave
- 914 Bryant Ave
- 910 Bryant Ave
- 902 Faile St
- 916 Bryant Ave
- 916 Bryant Ave Unit 1
- 908 Bryant Ave
- 918 Bryant Ave
- 906 Bryant Ave
- 900 Faile St
- 920 Bryant Ave
- 904 Bryant Ave