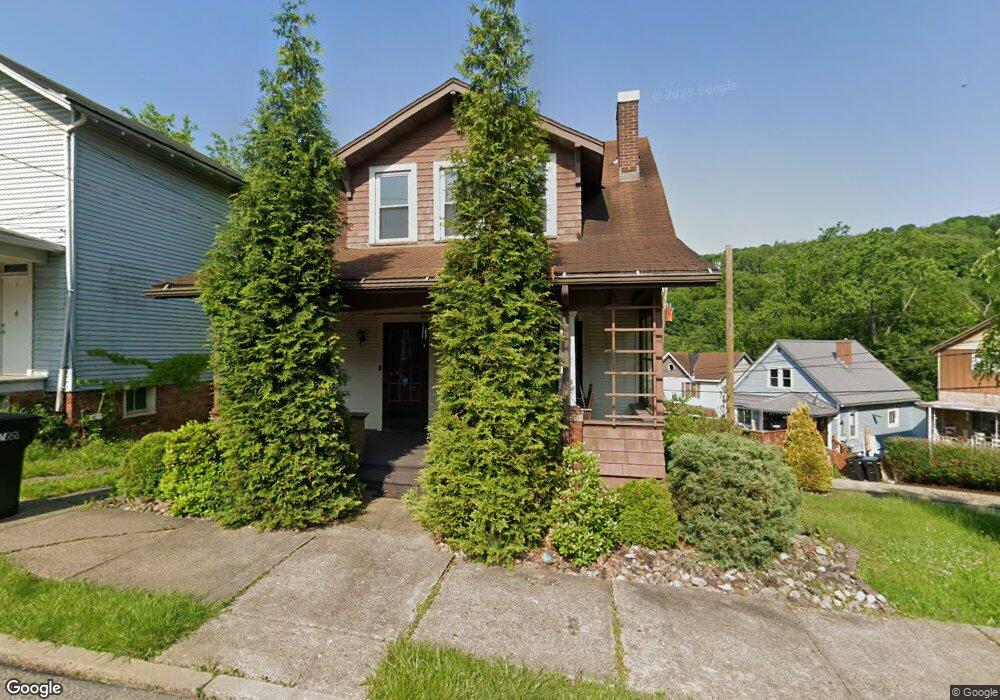
915 Butler St Tarentum, PA 15084
Estimated Value: $49,000 - $83,000
2
Beds
2
Baths
1,065
Sq Ft
$65/Sq Ft
Est. Value
About This Home
This home is located at 915 Butler St, Tarentum, PA 15084 and is currently estimated at $69,500, approximately $65 per square foot. 915 Butler St is a home located in Allegheny County with nearby schools including Highlands Senior High School, Mary Queen of Apostles School, and St. Joseph High School.
Ownership History
Date
Name
Owned For
Owner Type
Purchase Details
Closed on
Sep 12, 2016
Sold by
Barron Charles W and Barron Jennifer
Bought by
Early Clifford T and Early Diana C
Current Estimated Value
Purchase Details
Closed on
Feb 11, 2010
Sold by
Beers Robert W
Bought by
Barron Charles W
Home Financials for this Owner
Home Financials are based on the most recent Mortgage that was taken out on this home.
Original Mortgage
$23,200
Interest Rate
5.12%
Mortgage Type
New Conventional
Create a Home Valuation Report for This Property
The Home Valuation Report is an in-depth analysis detailing your home's value as well as a comparison with similar homes in the area
Home Values in the Area
Average Home Value in this Area
Purchase History
| Date | Buyer | Sale Price | Title Company |
|---|---|---|---|
| Early Clifford T | $19,000 | Attorney | |
| Barron Charles W | $29,000 | -- |
Source: Public Records
Mortgage History
| Date | Status | Borrower | Loan Amount |
|---|---|---|---|
| Previous Owner | Barron Charles W | $23,200 |
Source: Public Records
Tax History Compared to Growth
Tax History
| Year | Tax Paid | Tax Assessment Tax Assessment Total Assessment is a certain percentage of the fair market value that is determined by local assessors to be the total taxable value of land and additions on the property. | Land | Improvement |
|---|---|---|---|---|
| 2025 | $1,007 | $28,500 | $15,300 | $13,200 |
| 2024 | $1,007 | $28,500 | $15,300 | $13,200 |
| 2023 | $1,007 | $28,500 | $15,300 | $13,200 |
| 2022 | $1,000 | $28,500 | $15,300 | $13,200 |
| 2021 | $135 | $28,500 | $15,300 | $13,200 |
| 2020 | $1,000 | $28,500 | $15,300 | $13,200 |
| 2019 | $993 | $28,500 | $15,300 | $13,200 |
| 2018 | $969 | $28,500 | $15,300 | $13,200 |
| 2017 | $969 | $28,500 | $15,300 | $13,200 |
| 2016 | $135 | $28,500 | $15,300 | $13,200 |
| 2015 | $135 | $28,500 | $15,300 | $13,200 |
| 2014 | $969 | $28,500 | $15,300 | $13,200 |
Source: Public Records
Map
Nearby Homes