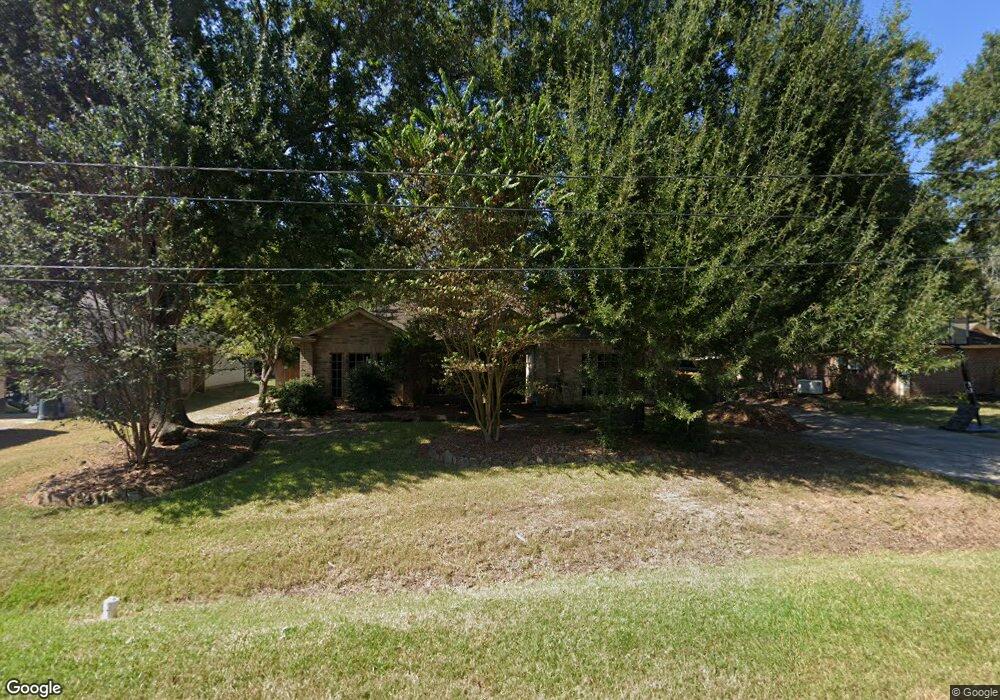
915 Carson Dr Magnolia, TX 77354
Estimated Value: $321,000 - $330,000
4
Beds
3
Baths
2,300
Sq Ft
$141/Sq Ft
Est. Value
About This Home
This home is located at 915 Carson Dr, Magnolia, TX 77354 and is currently estimated at $325,244, approximately $141 per square foot. 915 Carson Dr is a home located in Montgomery County with nearby schools including Tom R. Ellisor Elementary School, Bear Branch Junior High School, and Magnolia High School.
Ownership History
Date
Name
Owned For
Owner Type
Purchase Details
Closed on
Feb 27, 2004
Sold by
Marble Hailey C and Marble Robin
Bought by
Killy David and Killy Lisa
Current Estimated Value
Home Financials for this Owner
Home Financials are based on the most recent Mortgage that was taken out on this home.
Original Mortgage
$107,200
Outstanding Balance
$50,030
Interest Rate
5.65%
Mortgage Type
Purchase Money Mortgage
Estimated Equity
$275,214
Purchase Details
Closed on
Jul 31, 2000
Sold by
Royce Homes
Bought by
Marble Hailey C and Marble Robin
Home Financials for this Owner
Home Financials are based on the most recent Mortgage that was taken out on this home.
Original Mortgage
$109,000
Interest Rate
8.15%
Purchase Details
Closed on
Mar 1, 2000
Sold by
Stoecker Corporation
Bought by
Killy David and Killy Lisa
Create a Home Valuation Report for This Property
The Home Valuation Report is an in-depth analysis detailing your home's value as well as a comparison with similar homes in the area
Home Values in the Area
Average Home Value in this Area
Purchase History
| Date | Buyer | Sale Price | Title Company |
|---|---|---|---|
| Killy David | -- | Chicago Title | |
| Marble Hailey C | -- | Stewart Title | |
| Killy David | -- | -- |
Source: Public Records
Mortgage History
| Date | Status | Borrower | Loan Amount |
|---|---|---|---|
| Open | Killy David | $107,200 | |
| Previous Owner | Marble Hailey C | $109,000 | |
| Closed | Killy David | $26,800 |
Source: Public Records
Tax History Compared to Growth
Tax History
| Year | Tax Paid | Tax Assessment Tax Assessment Total Assessment is a certain percentage of the fair market value that is determined by local assessors to be the total taxable value of land and additions on the property. | Land | Improvement |
|---|---|---|---|---|
| 2025 | $3,618 | $311,064 | $58,000 | $253,064 |
| 2024 | $3,190 | $307,461 | -- | -- |
| 2023 | $3,190 | $279,510 | $58,000 | $278,100 |
| 2022 | $4,484 | $254,100 | $45,900 | $259,880 |
| 2021 | $4,294 | $231,000 | $42,500 | $195,350 |
| 2020 | $4,805 | $237,420 | $36,000 | $201,420 |
| 2019 | $4,381 | $217,530 | $36,000 | $185,760 |
| 2018 | $3,622 | $197,750 | $12,360 | $185,390 |
| 2017 | $4,193 | $197,750 | $12,360 | $185,390 |
| 2016 | $4,220 | $198,990 | $12,360 | $199,770 |
| 2015 | $3,313 | $180,900 | $12,360 | $183,120 |
| 2014 | $3,313 | $164,450 | $12,360 | $166,470 |
Source: Public Records
Map
Nearby Homes
- 7119 Durango Dr
- 7022 Dillon Dr
- 7010 Durango Dr
- 40317 De Sota Rd
- 6906 Grant Dr
- 7455 Durango Creek Dr
- 6902 Woodland Oaks
- 40108 Cimarron Way
- 6818 Woodland Oaks
- 40207 Cimarron Way
- 40715 Pipestone Rd
- 39526 Cimarron Way
- 8710 Linn Ln
- 6910 Woodland Oaks
- 7002 Durango Creek Dr
- 6626 Grant Dr
- 723 Hinsdale
- 7203 Cool Springs Ct
- 6846 Durango Creek Dr
- 40319 Three Forks Rd
- 919 Carson Dr
- 911 Carson Dr
- 0000 Carson Dr
- 923 Carson Dr
- 907 Carson Dr
- 7127 Hayden Dr
- 927 Carson Dr
- 7126 Hayden Dr
- 40202 Pipestone Rd
- 7123 Hayden Dr
- 7126 Durango Dr
- 7122 Hayden Dr
- 931 Carson Dr
- 827 Carson Dr
- 40206 Pipestone Rd
- 7127 Grant Dr
- 7119 Hayden Dr
- 7122 Durango Dr
- 7118 Hayden Dr
- 823 Carson Dr