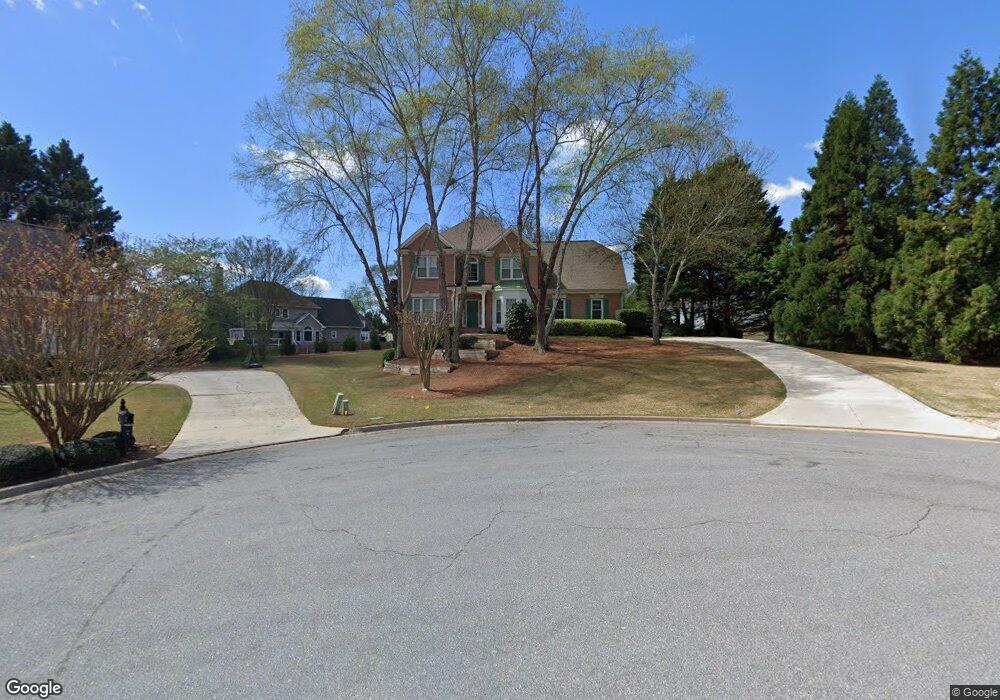
915 Davis Bend Alpharetta, GA 30004
Estimated Value: $790,414 - $953,000
4
Beds
3
Baths
2,128
Sq Ft
$401/Sq Ft
Est. Value
About This Home
This home is located at 915 Davis Bend, Alpharetta, GA 30004 and is currently estimated at $853,104, approximately $400 per square foot. 915 Davis Bend is a home located in Fulton County with nearby schools including Crabapple Crossing Elementary School, Northwestern Middle School, and Milton High School.
Ownership History
Date
Name
Owned For
Owner Type
Purchase Details
Closed on
Jul 31, 2007
Sold by
Paul David A and Paul Amy L
Bought by
Ruth Timothy P and Ruth Christina
Current Estimated Value
Home Financials for this Owner
Home Financials are based on the most recent Mortgage that was taken out on this home.
Original Mortgage
$97,600
Interest Rate
6.65%
Mortgage Type
New Conventional
Purchase Details
Closed on
Sep 26, 2001
Sold by
Paul David A
Bought by
Paul David A and Paul Amy L
Home Financials for this Owner
Home Financials are based on the most recent Mortgage that was taken out on this home.
Original Mortgage
$200,000
Interest Rate
6.89%
Mortgage Type
New Conventional
Purchase Details
Closed on
Apr 21, 1993
Sold by
Fetzer Props Ltd
Bought by
Paul David A
Home Financials for this Owner
Home Financials are based on the most recent Mortgage that was taken out on this home.
Original Mortgage
$127,900
Interest Rate
7.5%
Create a Home Valuation Report for This Property
The Home Valuation Report is an in-depth analysis detailing your home's value as well as a comparison with similar homes in the area
Home Values in the Area
Average Home Value in this Area
Purchase History
| Date | Buyer | Sale Price | Title Company |
|---|---|---|---|
| Ruth Timothy P | $427,500 | -- | |
| Paul David A | -- | -- | |
| Paul David A | $150,000 | -- |
Source: Public Records
Mortgage History
| Date | Status | Borrower | Loan Amount |
|---|---|---|---|
| Closed | Ruth Timothy P | $97,600 | |
| Previous Owner | Paul David A | $200,000 | |
| Previous Owner | Paul David A | $127,900 |
Source: Public Records
Tax History Compared to Growth
Tax History
| Year | Tax Paid | Tax Assessment Tax Assessment Total Assessment is a certain percentage of the fair market value that is determined by local assessors to be the total taxable value of land and additions on the property. | Land | Improvement |
|---|---|---|---|---|
| 2025 | $841 | $284,040 | $63,400 | $220,640 |
| 2023 | $7,854 | $278,240 | $67,360 | $210,880 |
| 2022 | $3,901 | $201,480 | $48,560 | $152,920 |
| 2021 | $4,588 | $186,680 | $46,760 | $139,920 |
| 2020 | $4,615 | $184,480 | $46,200 | $138,280 |
| 2019 | $698 | $173,280 | $44,360 | $128,920 |
| 2018 | $3,854 | $151,000 | $36,240 | $114,760 |
| 2017 | $3,850 | $145,200 | $34,840 | $110,360 |
| 2016 | $3,830 | $145,200 | $34,840 | $110,360 |
| 2015 | $4,478 | $145,200 | $34,840 | $110,360 |
| 2014 | $2,992 | $110,360 | $19,960 | $90,400 |
Source: Public Records
Map
Nearby Homes
- 1050 Little River Ln
- 1360 Bethany Ct
- 12455 Pindell Cir
- 785 Briars Bend
- 1395 Mid Broadwell Rd
- 1500 Mid Broadwell Rd
- 1065 Mid Broadwell Rd
- 145 Pruitt Dr
- 175 Heatherton Ln
- 1645 Mayfield Rd
- 245 Heatherton Way
- 7412 Mid Broadwell Trace
- 7411 Mid Broadwell Trace
- 275 Heatherton Way
- 265 Dania Dr
- 1510 Shade Tree Way
- 3058 Steeplechase Unit 4
- 12350 Charlotte Dr
- 3052 Steeplechase
- 3185 Brierfield Rd
- 820 Locust Grove Ct
- 925 Davis Bend
- 3195 Brierfield Rd
- 830 Locust Grove Ct
- 3175 Brierfield Rd
- 810 Locust Grove Ct
- 930 Davis Bend
- 910 Davis Bend
- 920 Davis Bend
- 840 Locust Grove Ct
- 800 Locust Grove Ct
- 0 Locust Grove Ct Unit 8661530
- 0 Locust Grove Ct Unit 8628509
- 0 Locust Grove Ct Unit 8159035
- 0 Locust Grove Ct
- 3215 Brierfield Rd
- 3180 Brierfield Rd
- 831 Locust Grove Ct