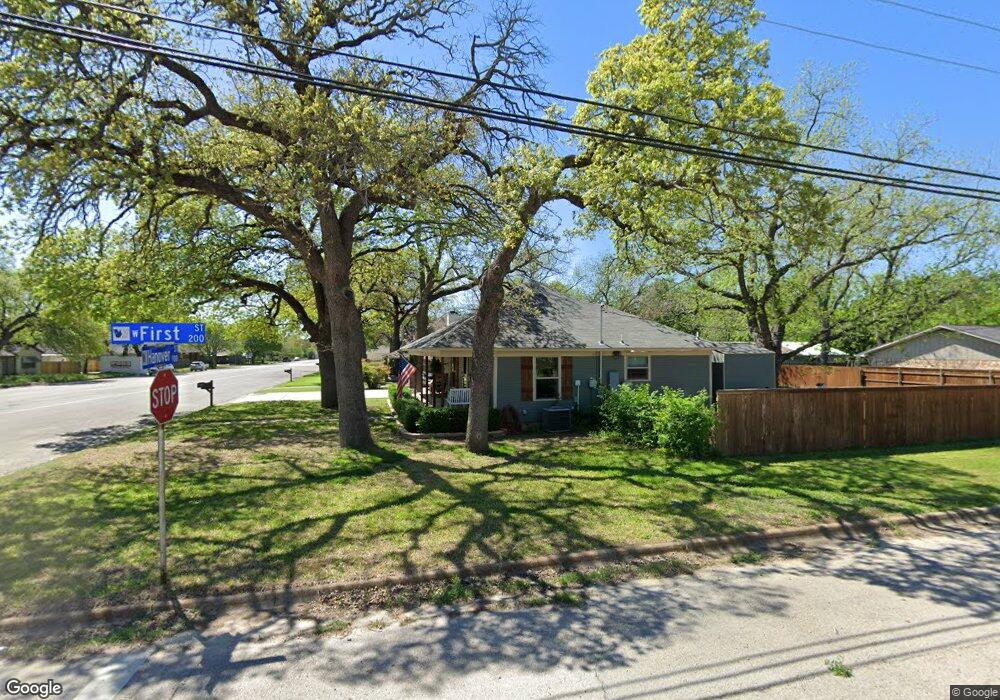
915 Hanover St Weatherford, TX 76086
Estimated Value: $197,057 - $230,000
--
Bed
--
Bath
908
Sq Ft
$241/Sq Ft
Est. Value
About This Home
This home is located at 915 Hanover St, Weatherford, TX 76086 and is currently estimated at $219,264, approximately $241 per square foot. 915 Hanover St is a home located in Parker County with nearby schools including Seguin Elementary School, Tison Middle School, and Weatherford High School.
Ownership History
Date
Name
Owned For
Owner Type
Purchase Details
Closed on
Sep 7, 2018
Sold by
Clj Construction Llc
Bought by
Wright Anthony and Wright Melissa
Current Estimated Value
Home Financials for this Owner
Home Financials are based on the most recent Mortgage that was taken out on this home.
Original Mortgage
$123,500
Outstanding Balance
$107,570
Interest Rate
4.54%
Estimated Equity
$111,694
Purchase Details
Closed on
Jun 6, 2017
Sold by
Schult Stephen
Bought by
Clj Construction Llc
Purchase Details
Closed on
Dec 20, 2007
Sold by
Henderson Lee Ragland
Bought by
Clj Construction Llc
Purchase Details
Closed on
Jan 20, 2006
Sold by
Henderson Evelyn and Henderson Dmr
Bought by
Clj Construction Llc
Purchase Details
Closed on
Aug 17, 2004
Sold by
Bass Karen G
Bought by
Clj Construction Llc
Purchase Details
Closed on
Jun 15, 2001
Sold by
Henderson Evelyn J
Bought by
Clj Construction Llc
Create a Home Valuation Report for This Property
The Home Valuation Report is an in-depth analysis detailing your home's value as well as a comparison with similar homes in the area
Home Values in the Area
Average Home Value in this Area
Purchase History
| Date | Buyer | Sale Price | Title Company |
|---|---|---|---|
| Wright Anthony | -- | -- | |
| Clj Construction Llc | -- | None Available | |
| Clj Construction Llc | -- | -- | |
| Schult Stephen | -- | None Available | |
| Clj Construction Llc | -- | -- | |
| Henderson Lee Ragland | -- | None Available | |
| Clj Construction Llc | -- | -- | |
| Clj Construction Llc | -- | -- |
Source: Public Records
Mortgage History
| Date | Status | Borrower | Loan Amount |
|---|---|---|---|
| Open | Wright Anthony | $123,500 | |
| Closed | Wright Anthony | -- |
Source: Public Records
Tax History Compared to Growth
Tax History
| Year | Tax Paid | Tax Assessment Tax Assessment Total Assessment is a certain percentage of the fair market value that is determined by local assessors to be the total taxable value of land and additions on the property. | Land | Improvement |
|---|---|---|---|---|
| 2025 | $1,723 | $218,780 | -- | -- |
| 2024 | $1,723 | $198,891 | -- | -- |
| 2023 | $1,723 | $180,810 | $0 | $0 |
| 2022 | $3,646 | $164,380 | $15,000 | $149,380 |
| 2021 | $3,785 | $164,380 | $15,000 | $149,380 |
| 2020 | $3,462 | $143,290 | $15,000 | $128,290 |
| 2019 | $3,167 | $124,000 | $15,000 | $109,000 |
| 2018 | $1,426 | $55,610 | $15,000 | $40,610 |
| 2017 | $1,463 | $55,610 | $15,000 | $40,610 |
| 2016 | $1,266 | $48,110 | $15,000 | $33,110 |
| 2015 | $1,240 | $48,110 | $15,000 | $33,110 |
| 2014 | $1,117 | $44,470 | $15,000 | $29,470 |
Source: Public Records
Map
Nearby Homes
- 911 Hanover St
- 205 W 1st St
- 1001 Hanover St
- 909 Hanover St
- 912 Hanover St
- 213 W 1st St
- 906 Hanover St
- 1005 Hanover St
- 907 Hanover St
- 210 W 1st St
- 209 W 1st St
- 111 W 1st St
- 1007 Hanover St
- 214 W 1st St
- 212 W 1st St
- 202 W Weatherford St
- 109 W 1st St
- 116 W Weatherford St
- 206 W Weatherford St
- 215 W 1st St