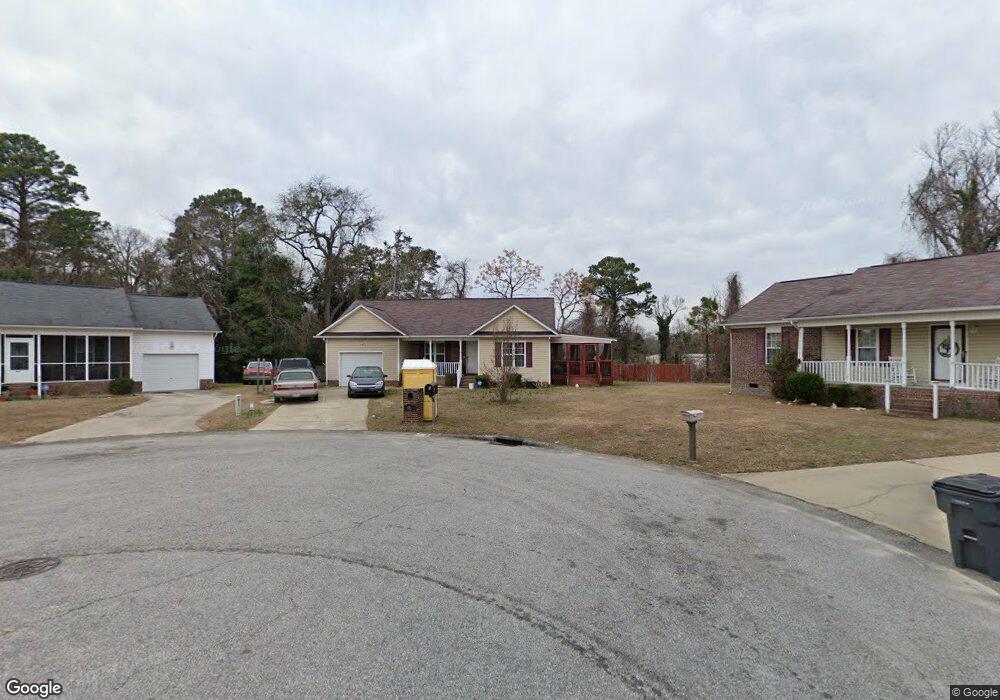
915 Lexis Walk Cir Spring Lake, NC 28390
Estimated Value: $184,000 - $220,983
3
Beds
2
Baths
1,188
Sq Ft
$170/Sq Ft
Est. Value
About This Home
This home is located at 915 Lexis Walk Cir, Spring Lake, NC 28390 and is currently estimated at $201,996, approximately $170 per square foot. 915 Lexis Walk Cir is a home located in Cumberland County with nearby schools including Manchester Elementary School, Spring Lake Middle, and Pine Forest High.
Ownership History
Date
Name
Owned For
Owner Type
Purchase Details
Closed on
Oct 26, 2009
Sold by
Kingdom Community Dev Corp
Bought by
French Lashonda S
Current Estimated Value
Home Financials for this Owner
Home Financials are based on the most recent Mortgage that was taken out on this home.
Original Mortgage
$50,000
Outstanding Balance
$32,665
Interest Rate
5.01%
Mortgage Type
New Conventional
Estimated Equity
$169,331
Create a Home Valuation Report for This Property
The Home Valuation Report is an in-depth analysis detailing your home's value as well as a comparison with similar homes in the area
Home Values in the Area
Average Home Value in this Area
Purchase History
| Date | Buyer | Sale Price | Title Company |
|---|---|---|---|
| French Lashonda S | $100,000 | -- |
Source: Public Records
Mortgage History
| Date | Status | Borrower | Loan Amount |
|---|---|---|---|
| Open | French Lashonda S | $50,000 |
Source: Public Records
Tax History Compared to Growth
Tax History
| Year | Tax Paid | Tax Assessment Tax Assessment Total Assessment is a certain percentage of the fair market value that is determined by local assessors to be the total taxable value of land and additions on the property. | Land | Improvement |
|---|---|---|---|---|
| 2024 | $2,210 | $132,260 | $33,000 | $99,260 |
| 2023 | $2,210 | $132,260 | $33,000 | $99,260 |
| 2022 | $2,005 | $132,260 | $33,000 | $99,260 |
| 2021 | $29 | $132,260 | $33,000 | $99,260 |
| 2019 | $1,976 | $111,100 | $33,000 | $78,100 |
| 2018 | $1,976 | $111,100 | $33,000 | $78,100 |
| 2017 | $1,976 | $111,100 | $33,000 | $78,100 |
| 2016 | $1,770 | $101,300 | $16,500 | $84,800 |
| 2015 | $1,770 | $101,300 | $16,500 | $84,800 |
| 2014 | $1,770 | $101,300 | $16,500 | $84,800 |
Source: Public Records
Map
Nearby Homes