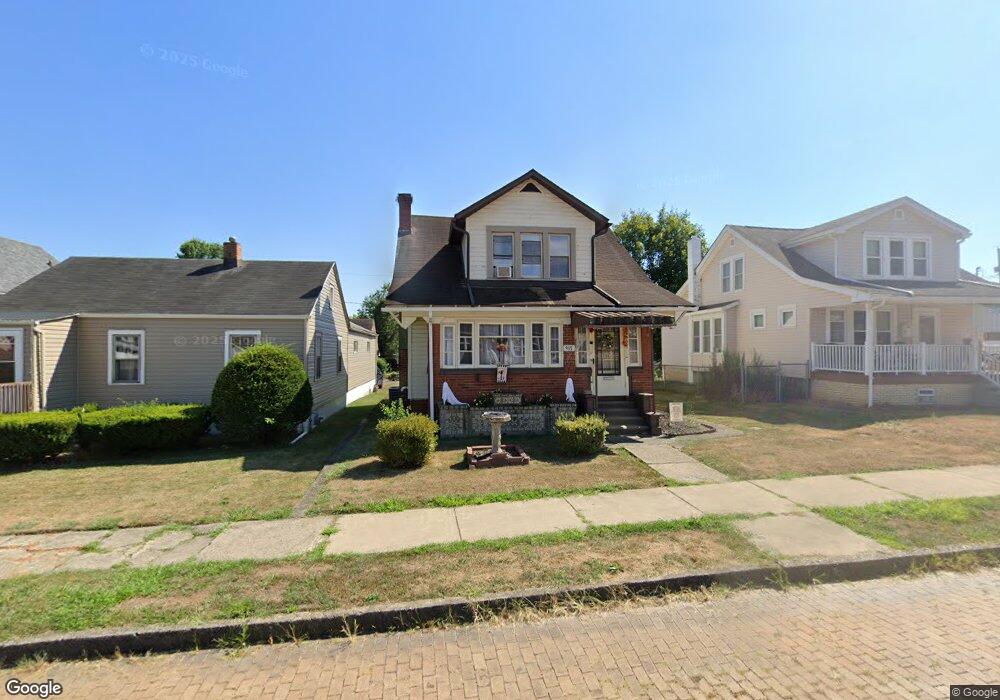
915 Logan St Toronto, OH 43964
Estimated Value: $124,055 - $139,000
3
Beds
2
Baths
1,100
Sq Ft
$119/Sq Ft
Est. Value
About This Home
This home is located at 915 Logan St, Toronto, OH 43964 and is currently estimated at $131,264, approximately $119 per square foot. 915 Logan St is a home located in Jefferson County with nearby schools including Toronto Jr./Sr. High School and St. Francis Central School.
Ownership History
Date
Name
Owned For
Owner Type
Purchase Details
Closed on
Jun 5, 2025
Sold by
Dacko Mary and Redmond Patricia A
Bought by
Payne William C and Payne Emily M
Current Estimated Value
Home Financials for this Owner
Home Financials are based on the most recent Mortgage that was taken out on this home.
Original Mortgage
$123,190
Outstanding Balance
$122,874
Interest Rate
6.81%
Mortgage Type
New Conventional
Estimated Equity
$8,390
Purchase Details
Closed on
Feb 28, 2013
Sold by
Stasiulewcz Norvegia
Bought by
Dacko Mary and Redmond Patricia
Create a Home Valuation Report for This Property
The Home Valuation Report is an in-depth analysis detailing your home's value as well as a comparison with similar homes in the area
Home Values in the Area
Average Home Value in this Area
Purchase History
| Date | Buyer | Sale Price | Title Company |
|---|---|---|---|
| Payne William C | $127,000 | Ohio Valley Title | |
| Payne William C | $127,000 | Ohio Valley Title | |
| Dacko Mary | -- | -- |
Source: Public Records
Mortgage History
| Date | Status | Borrower | Loan Amount |
|---|---|---|---|
| Open | Payne William C | $123,190 | |
| Closed | Payne William C | $123,190 |
Source: Public Records
Tax History Compared to Growth
Tax History
| Year | Tax Paid | Tax Assessment Tax Assessment Total Assessment is a certain percentage of the fair market value that is determined by local assessors to be the total taxable value of land and additions on the property. | Land | Improvement |
|---|---|---|---|---|
| 2024 | $1,218 | $33,922 | $3,472 | $30,450 |
| 2023 | $1,218 | $23,793 | $2,940 | $20,853 |
| 2022 | $918 | $23,793 | $2,940 | $20,853 |
| 2021 | $918 | $23,793 | $2,940 | $20,853 |
| 2020 | $789 | $19,982 | $2,380 | $17,602 |
| 2019 | $792 | $0 | $0 | $0 |
| 2018 | $787 | $0 | $0 | $0 |
| 2017 | $831 | $0 | $0 | $0 |
| 2016 | $846 | $0 | $0 | $0 |
| 2015 | $835 | $0 | $0 | $0 |
| 2014 | $797 | $0 | $0 | $0 |
| 2012 | $203 | $18,760 | $2,975 | $15,785 |
Source: Public Records
Map
Nearby Homes