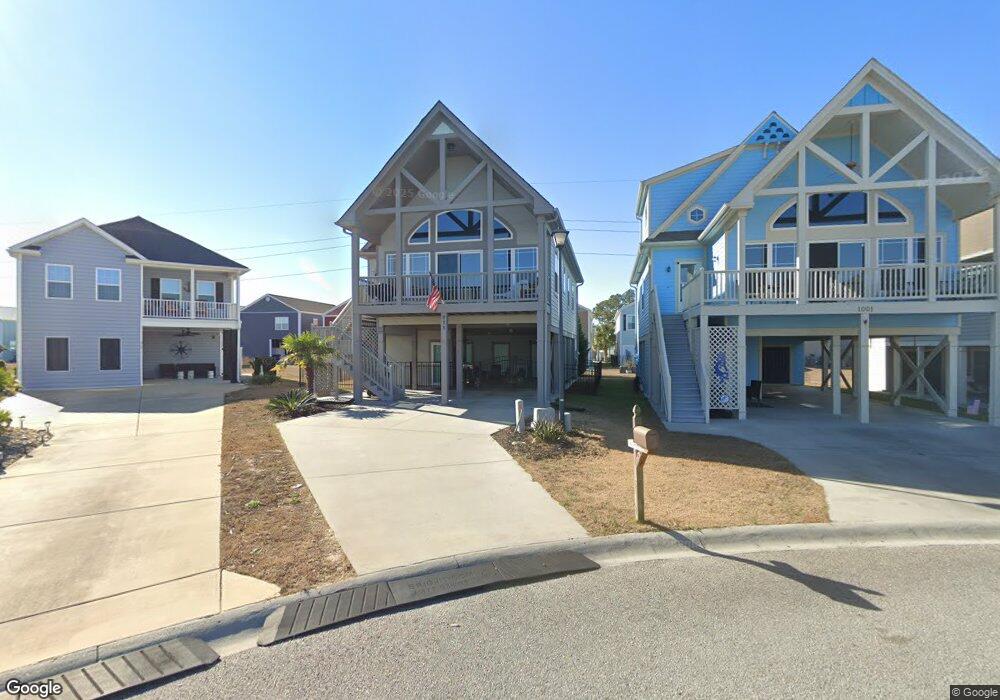
915 Ocean Pines Ct Unit Lot-10 Bungalow North Myrtle Beach, SC 29582
Ocean Drive NeighborhoodEstimated Value: $464,000 - $487,000
3
Beds
3
Baths
3,501
Sq Ft
$136/Sq Ft
Est. Value
About This Home
This home is located at 915 Ocean Pines Ct Unit Lot-10 Bungalow, North Myrtle Beach, SC 29582 and is currently estimated at $474,918, approximately $135 per square foot. 915 Ocean Pines Ct Unit Lot-10 Bungalow is a home located in Horry County with nearby schools including Ocean Drive Elementary School, North Myrtle Beach Middle School, and North Myrtle Beach High School.
Ownership History
Date
Name
Owned For
Owner Type
Purchase Details
Closed on
Sep 26, 2017
Sold by
Mullen William G
Bought by
Bowen Anthony S
Current Estimated Value
Home Financials for this Owner
Home Financials are based on the most recent Mortgage that was taken out on this home.
Original Mortgage
$277,874
Outstanding Balance
$232,414
Interest Rate
3.87%
Mortgage Type
FHA
Estimated Equity
$242,504
Purchase Details
Closed on
Oct 25, 2016
Sold by
Cagle William J
Bought by
Mullen William G and Mullen Shelly L
Home Financials for this Owner
Home Financials are based on the most recent Mortgage that was taken out on this home.
Original Mortgage
$259,600
Interest Rate
3.42%
Mortgage Type
Stand Alone Refi Refinance Of Original Loan
Purchase Details
Closed on
Jun 25, 2008
Sold by
Tidewater Builders Inc
Bought by
Cagle William J and Cagle Holly G
Home Financials for this Owner
Home Financials are based on the most recent Mortgage that was taken out on this home.
Original Mortgage
$362,225
Interest Rate
6.08%
Mortgage Type
Purchase Money Mortgage
Create a Home Valuation Report for This Property
The Home Valuation Report is an in-depth analysis detailing your home's value as well as a comparison with similar homes in the area
Home Values in the Area
Average Home Value in this Area
Purchase History
| Date | Buyer | Sale Price | Title Company |
|---|---|---|---|
| Bowen Anthony S | $283,000 | -- | |
| Mullen William G | $268,000 | -- | |
| Cagle William J | $381,290 | -- | |
| Tidewater Builders Inc | $135,000 | -- |
Source: Public Records
Mortgage History
| Date | Status | Borrower | Loan Amount |
|---|---|---|---|
| Open | Bowen Anthony S | $277,874 | |
| Previous Owner | Mullen William G | $259,600 | |
| Previous Owner | Tidewater Builders Inc | $362,225 |
Source: Public Records
Tax History Compared to Growth
Tax History
| Year | Tax Paid | Tax Assessment Tax Assessment Total Assessment is a certain percentage of the fair market value that is determined by local assessors to be the total taxable value of land and additions on the property. | Land | Improvement |
|---|---|---|---|---|
| 2024 | -- | $22,692 | $6,093 | $16,599 |
| 2023 | $0 | $11,942 | $2,662 | $9,280 |
| 2021 | $1,292 | $31,347 | $6,987 | $24,360 |
| 2020 | $1,262 | $31,347 | $6,987 | $24,360 |
| 2019 | $1,168 | $31,347 | $6,987 | $24,360 |
| 2018 | $1,197 | $29,711 | $5,981 | $23,730 |
| 2017 | $1,099 | $24,118 | $2,278 | $21,840 |
| 2016 | -- | $19,521 | $1,828 | $17,693 |
| 2015 | $2,889 | $22,493 | $4,800 | $17,693 |
| 2014 | $2,796 | $12,853 | $2,743 | $10,110 |
Source: Public Records
Map
Nearby Homes
- 910 Emanon St
- 609 Bay St
- 705 Bay St
- 1014 Thomas Ave
- 1165 6th Ave S
- 620 Wave Rider Ln Unit B10-1
- 753 Shell Creek Cir Unit B19-2
- 601 Gayle St
- 611 Surfsong Way Unit B6-3
- 810 Belle Dr
- 745 Shell Creek Cir Unit 745
- 606 7th Ave S Unit F
- 917 9th Ave S
- 739 Shell Creek Cir Unit 739
- 618 5th Ave S
- BELFORT Plan at Belle Park
- CUMBERLAND Plan at Belle Park
- BRADFORD Plan at Belle Park
- TILLMAN Plan at Belle Park
- MADISON Plan at Belle Park
- 915 Ocean Pines Ct
- 1001 Ocean Pines Ct Unit The Bungalow
- 1001 Ocean Pines Ct
- 1001 Ocean Pines Ct Unit Lot 11 Ocean Pines--
- 913 Ocean Pines Ct
- TBD1 Ocean Pines Ct
- 1003 Ocean Pines Ct
- 1003 Ocean Pines Ct Unit Lot 12 The Cabin
- 909 Ocean Pines Ct
- 1005 Ocean Pines Ct Unit Getaway Collection @
- 1005 Ocean Pines Ct
- 1005 Ocean Pines Ct Unit Lot 13 Ocean Pines-T
- 717 Ashland Ave
- 703 Ashland Ave
- 1002 Ocean Pines Ct
- 1002 Ocean Pines Ct Unit Lot 3 Ocean Pines
- 1000 6th Ave S
- 907 Ocean Pines Ct
- 907 Ocean Pines Ct Unit Lot 6 Ocean Pines
- 1007 Ocean Pines Ct