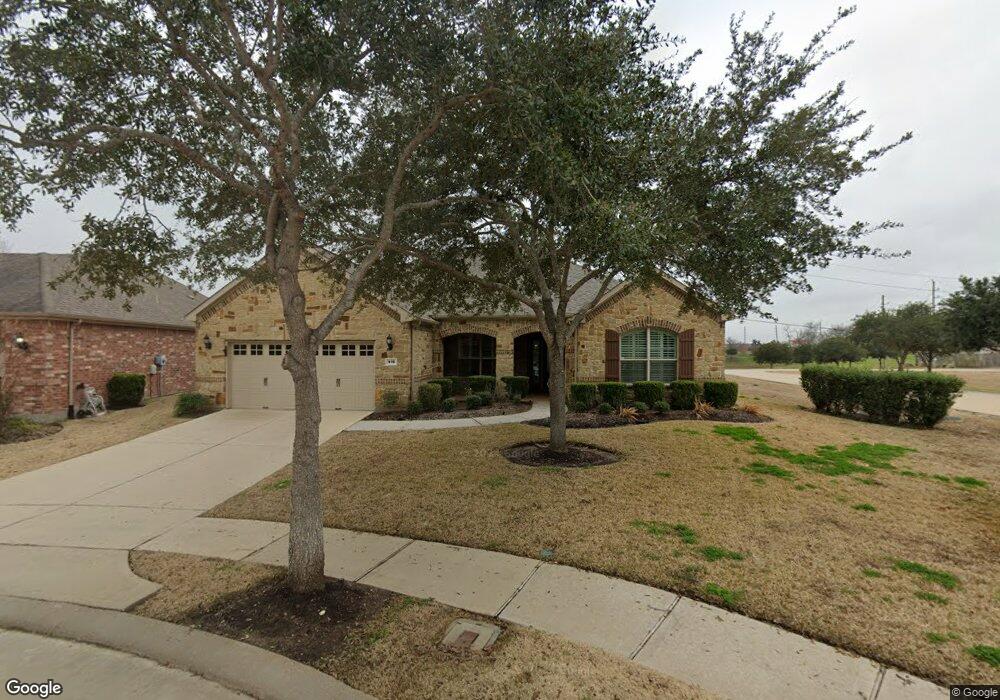
915 Texas Star Dr Richmond, TX 77469
Estimated Value: $486,000 - $532,000
2
Beds
3
Baths
2,552
Sq Ft
$198/Sq Ft
Est. Value
About This Home
This home is located at 915 Texas Star Dr, Richmond, TX 77469 and is currently estimated at $504,580, approximately $197 per square foot. 915 Texas Star Dr is a home located in Fort Bend County with nearby schools including J J Wessendorff Middle School, Lamar Junior High School, and Lamar Consolidated High School.
Ownership History
Date
Name
Owned For
Owner Type
Purchase Details
Closed on
Oct 31, 2014
Sold by
Farmer Matilda and Franklin Darold B
Bought by
Cogdell Russell R and Cogdell Tricia A
Current Estimated Value
Home Financials for this Owner
Home Financials are based on the most recent Mortgage that was taken out on this home.
Original Mortgage
$80,000
Outstanding Balance
$61,843
Interest Rate
4.25%
Mortgage Type
New Conventional
Estimated Equity
$442,737
Purchase Details
Closed on
Feb 16, 2012
Sold by
Farmer Matilda Ann Spillman and Estate Of Benny Harold Farmer
Bought by
Farmer Matilda
Purchase Details
Closed on
Nov 10, 2011
Sold by
Pulte Homes Of Texas Lp
Bought by
Farmer Matilda and Farmer Benny
Home Financials for this Owner
Home Financials are based on the most recent Mortgage that was taken out on this home.
Original Mortgage
$243,716
Interest Rate
4.08%
Mortgage Type
New Conventional
Create a Home Valuation Report for This Property
The Home Valuation Report is an in-depth analysis detailing your home's value as well as a comparison with similar homes in the area
Home Values in the Area
Average Home Value in this Area
Purchase History
| Date | Buyer | Sale Price | Title Company |
|---|---|---|---|
| Cogdell Russell R | -- | None Available | |
| Farmer Matilda | -- | Platinum Title | |
| Farmer Matilda | -- | None Available | |
| Cogdell Russell R | -- | -- | |
| Farmer Matilda | -- | None Available | |
| Cogdell Russell R | -- | -- |
Source: Public Records
Mortgage History
| Date | Status | Borrower | Loan Amount |
|---|---|---|---|
| Open | Cogdell Russell R | $80,000 | |
| Previous Owner | Cogdell Russell R | $243,716 |
Source: Public Records
Tax History Compared to Growth
Tax History
| Year | Tax Paid | Tax Assessment Tax Assessment Total Assessment is a certain percentage of the fair market value that is determined by local assessors to be the total taxable value of land and additions on the property. | Land | Improvement |
|---|---|---|---|---|
| 2025 | $6,980 | $492,676 | $109,200 | $383,476 |
| 2024 | $6,980 | $485,573 | $78,208 | $407,365 |
| 2023 | $7,106 | $441,430 | $43,988 | $397,442 |
| 2022 | $9,328 | $401,300 | $71,250 | $330,050 |
| 2021 | $10,780 | $364,820 | $84,000 | $280,820 |
| 2020 | $10,971 | $361,200 | $82,690 | $278,510 |
| 2019 | $11,267 | $348,390 | $82,690 | $265,700 |
| 2018 | $11,981 | $366,490 | $82,690 | $283,800 |
| 2017 | $11,951 | $362,800 | $82,690 | $280,110 |
| 2016 | $11,167 | $338,990 | $71,660 | $267,330 |
| 2015 | $4,672 | $317,320 | $71,660 | $245,660 |
| 2014 | $3,411 | $291,680 | $66,780 | $224,900 |
Source: Public Records
Map
Nearby Homes
- 809 Cardinal Flower Dr
- 2918 Persimmon Grove
- 1022 Majestic Oak
- 2951 Coral Berry Ct
- 2926 Coral Berry Ct
- 1115 Majestic Oak
- 3503 Anchor Cove
- 6600 Fm 762 Rd
- 7034 Glennwick Grove Ln
- 1311 Hudgins Pass
- 3322 Harvest Meadow Ln
- 1234 Willow Plains Ln
- 23814 Pullin Market Dr
- 2811 Cone Flower Dr
- 1202 Watercrest Park Ln
- 24331 Dyer Hill Way
- 3507 Satin Leaf Ln
- 1235 Oxbow Crossing Ln
- 23743 Travers Hill Rd
- 24323 Rose Cobbler Dr
- 911 Texas Star Dr
- 907 Texas Star Dr
- 903 Texas Star Dr
- 910 Texas Star Dr
- 914 Texas Star Dr
- 906 Texas Star Dr
- 831 Texas Star Dr
- 902 Texas Star Dr
- 826 Cardinal Flower Dr
- 823 Texas Star Dr
- 829 Cardinal Flower Dr
- 822 Cardinal Flower Dr
- 821 Cardinal Flower Dr
- 819 Texas Star Dr
- 818 Texas Star Dr
- 815 Texas Star Dr
- 814 Texas Star Dr
- 814 Cardinal Flower Dr
- 811 Texas Star Dr
- 810 Texas Star Dr