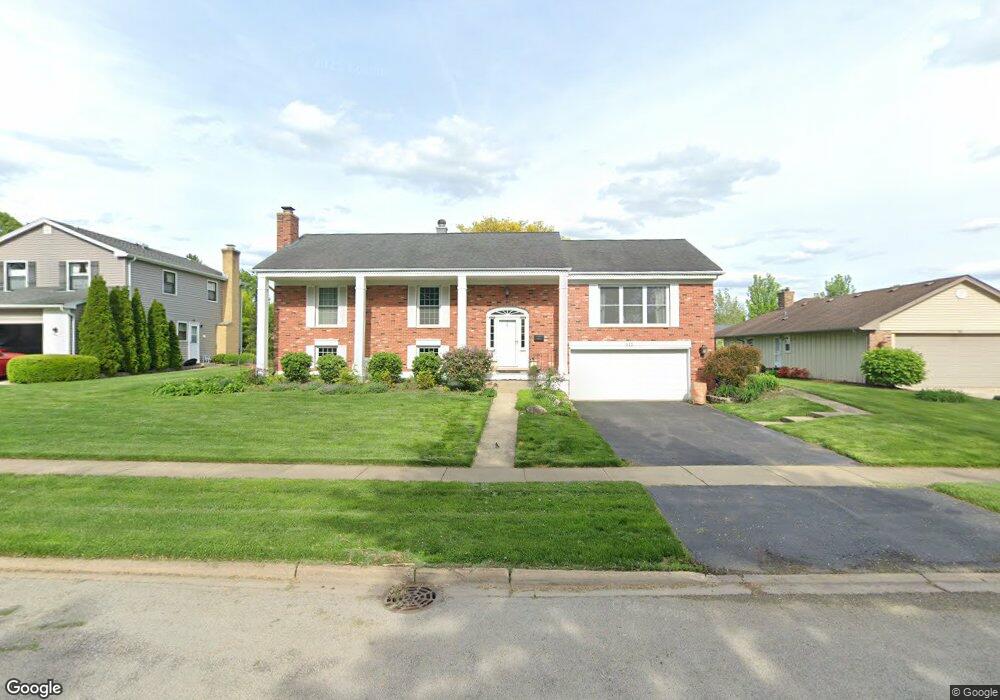
915 W Sparrow Ct Palatine, IL 60067
Plum Grove Village NeighborhoodEstimated Value: $536,000 - $577,000
4
Beds
3
Baths
1,617
Sq Ft
$345/Sq Ft
Est. Value
About This Home
This home is located at 915 W Sparrow Ct, Palatine, IL 60067 and is currently estimated at $557,980, approximately $345 per square foot. 915 W Sparrow Ct is a home located in Cook County with nearby schools including Hunting Ridge Elementary School, Plum Grove Jr High School, and William Fremd High School.
Ownership History
Date
Name
Owned For
Owner Type
Purchase Details
Closed on
Mar 17, 2006
Sold by
Jambhekar Shirang
Bought by
Albert Maureen
Current Estimated Value
Home Financials for this Owner
Home Financials are based on the most recent Mortgage that was taken out on this home.
Original Mortgage
$418,000
Outstanding Balance
$233,857
Interest Rate
6%
Mortgage Type
Unknown
Estimated Equity
$324,123
Purchase Details
Closed on
Mar 20, 1997
Sold by
Penksa Ronald L and Penksa Leslie
Bought by
Jambrekar Shrirang
Home Financials for this Owner
Home Financials are based on the most recent Mortgage that was taken out on this home.
Original Mortgage
$196,000
Interest Rate
6.62%
Purchase Details
Closed on
Jun 16, 1995
Sold by
Smith Kent R and Smith Sandra R
Bought by
Penksa Ronald L and Penksa Leslie
Home Financials for this Owner
Home Financials are based on the most recent Mortgage that was taken out on this home.
Original Mortgage
$190,400
Interest Rate
7.9%
Create a Home Valuation Report for This Property
The Home Valuation Report is an in-depth analysis detailing your home's value as well as a comparison with similar homes in the area
Home Values in the Area
Average Home Value in this Area
Purchase History
| Date | Buyer | Sale Price | Title Company |
|---|---|---|---|
| Albert Maureen | $440,000 | First American Title Ins Co | |
| Jambrekar Shrirang | $245,000 | Chicago Title Insurance Co | |
| Penksa Ronald L | $238,000 | Lawyers Title Insurance Corp |
Source: Public Records
Mortgage History
| Date | Status | Borrower | Loan Amount |
|---|---|---|---|
| Open | Albert Maureen | $418,000 | |
| Previous Owner | Jambrekar Shrirang | $196,000 | |
| Previous Owner | Penksa Ronald L | $190,400 |
Source: Public Records
Tax History Compared to Growth
Tax History
| Year | Tax Paid | Tax Assessment Tax Assessment Total Assessment is a certain percentage of the fair market value that is determined by local assessors to be the total taxable value of land and additions on the property. | Land | Improvement |
|---|---|---|---|---|
| 2024 | $11,157 | $41,000 | $10,854 | $30,146 |
| 2023 | $10,763 | $41,000 | $10,854 | $30,146 |
| 2022 | $10,763 | $41,000 | $10,854 | $30,146 |
| 2021 | $10,278 | $34,978 | $7,236 | $27,742 |
| 2020 | $10,198 | $34,978 | $7,236 | $27,742 |
| 2019 | $10,138 | $38,779 | $7,236 | $31,543 |
| 2018 | $10,371 | $36,807 | $6,633 | $30,174 |
| 2017 | $10,193 | $36,807 | $6,633 | $30,174 |
| 2016 | $9,728 | $36,807 | $6,633 | $30,174 |
| 2015 | $9,028 | $32,008 | $6,030 | $25,978 |
| 2014 | $8,935 | $32,008 | $6,030 | $25,978 |
| 2013 | $8,689 | $32,008 | $6,030 | $25,978 |
Source: Public Records
Map
Nearby Homes
- Lot 2, Nessie's Grov Aldridge Ave
- 824 W Dorset Ave
- 335 S Crescent Ave
- 834 W Dorchester Rd
- 635 W Kenilworth Ave
- 1110 S Plum Tree Ln
- 412 S Cedar St
- 108 S Hickory St
- 418 S Rose St
- 354 Grayfriars Ln
- 222 S Maple St
- 272 W Prestwick St
- 278 W Illinois Ave
- 65 N Averry Ct
- 1020 W Bogey Ln
- 1022 W Bogey Ln
- 1120 Roselle Rd
- 1021 W Bogey Ln
- 1120 W Wilson St
- 1122 W Wilson St
- 911 W Sparrow Ct
- 917 W Sparrow Ct
- 877 W Lanark Ln
- 873 W Lanark Ln
- 933 W Gilbert Rd
- 921 W Sparrow Ct
- 931 W Sparrow Ct
- 869 W Lanark Ln
- 910 W Gilbert Rd
- 922 W Gilbert Rd
- 939 W Gilbert Rd
- 904 W Gilbert Rd
- 923 W Sparrow Ct
- 929 W Sparrow Ct
- 928 W Gilbert Rd
- 925 W Sparrow Ct
- 841 W Lanark Ln
- 711 Middleton Ct
- 845 W Lanark Ln