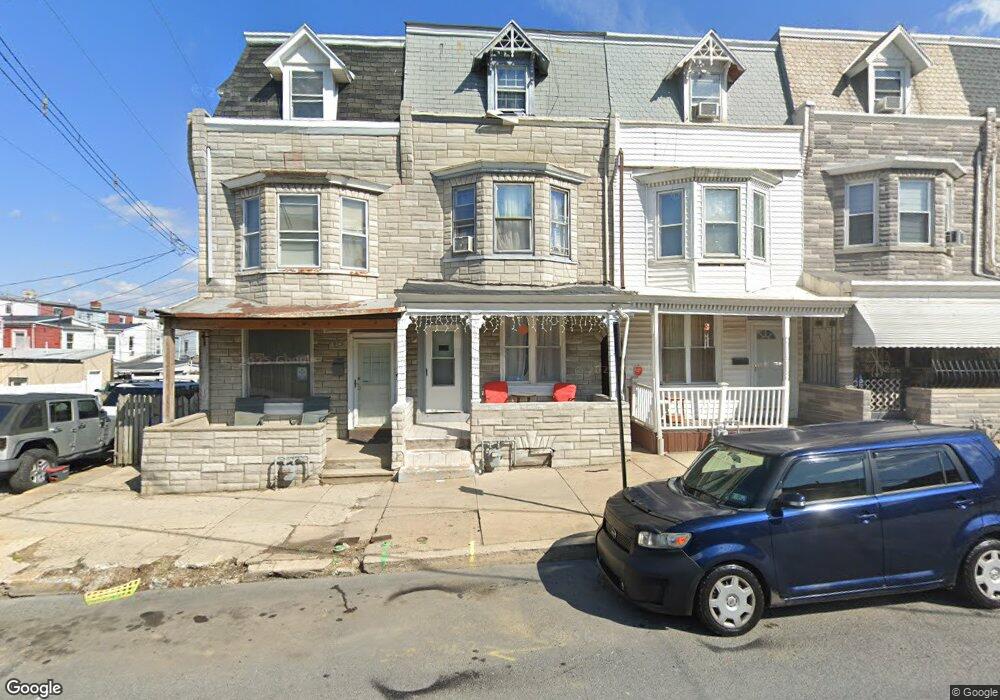
915 Windsor St Reading, PA 19604
Outlet Area NeighborhoodEstimated Value: $163,261 - $212,000
5
Beds
2
Baths
2,064
Sq Ft
$91/Sq Ft
Est. Value
About This Home
This home is located at 915 Windsor St, Reading, PA 19604 and is currently estimated at $187,065, approximately $90 per square foot. 915 Windsor St is a home located in Berks County with nearby schools including Tenth & Green El School, Central Middle School, and Reading Senior High School.
Ownership History
Date
Name
Owned For
Owner Type
Purchase Details
Closed on
Feb 17, 2004
Sold by
Gizinski Leonard J and Gizinski Colleen H
Bought by
Martinez Ruben
Current Estimated Value
Home Financials for this Owner
Home Financials are based on the most recent Mortgage that was taken out on this home.
Original Mortgage
$28,500
Outstanding Balance
$13,171
Interest Rate
5.62%
Mortgage Type
Purchase Money Mortgage
Estimated Equity
$173,894
Create a Home Valuation Report for This Property
The Home Valuation Report is an in-depth analysis detailing your home's value as well as a comparison with similar homes in the area
Home Values in the Area
Average Home Value in this Area
Purchase History
| Date | Buyer | Sale Price | Title Company |
|---|---|---|---|
| Martinez Ruben | $30,000 | -- |
Source: Public Records
Mortgage History
| Date | Status | Borrower | Loan Amount |
|---|---|---|---|
| Open | Martinez Ruben | $28,500 |
Source: Public Records
Tax History
| Year | Tax Paid | Tax Assessment Tax Assessment Total Assessment is a certain percentage of the fair market value that is determined by local assessors to be the total taxable value of land and additions on the property. | Land | Improvement |
|---|---|---|---|---|
| 2025 | $1,284 | $47,300 | $15,000 | $32,300 |
| 2024 | $2,100 | $47,300 | $15,000 | $32,300 |
| 2023 | $2,068 | $47,300 | $15,000 | $32,300 |
| 2022 | $2,068 | $47,300 | $15,000 | $32,300 |
| 2021 | $2,068 | $47,300 | $15,000 | $32,300 |
| 2020 | $2,047 | $47,300 | $15,000 | $32,300 |
| 2019 | $2,047 | $47,300 | $15,000 | $32,300 |
| 2018 | $2,047 | $47,300 | $15,000 | $32,300 |
| 2017 | $2,033 | $47,300 | $15,000 | $32,300 |
| 2016 | $1,162 | $47,300 | $15,000 | $32,300 |
| 2015 | $1,162 | $47,300 | $15,000 | $32,300 |
| 2014 | $1,069 | $47,300 | $15,000 | $32,300 |
Source: Public Records
Map
Nearby Homes
Your Personal Tour Guide
Ask me questions while you tour the home.