Estimated Value: $447,042 - $466,000
3
Beds
2
Baths
1,460
Sq Ft
$313/Sq Ft
Est. Value
About This Home
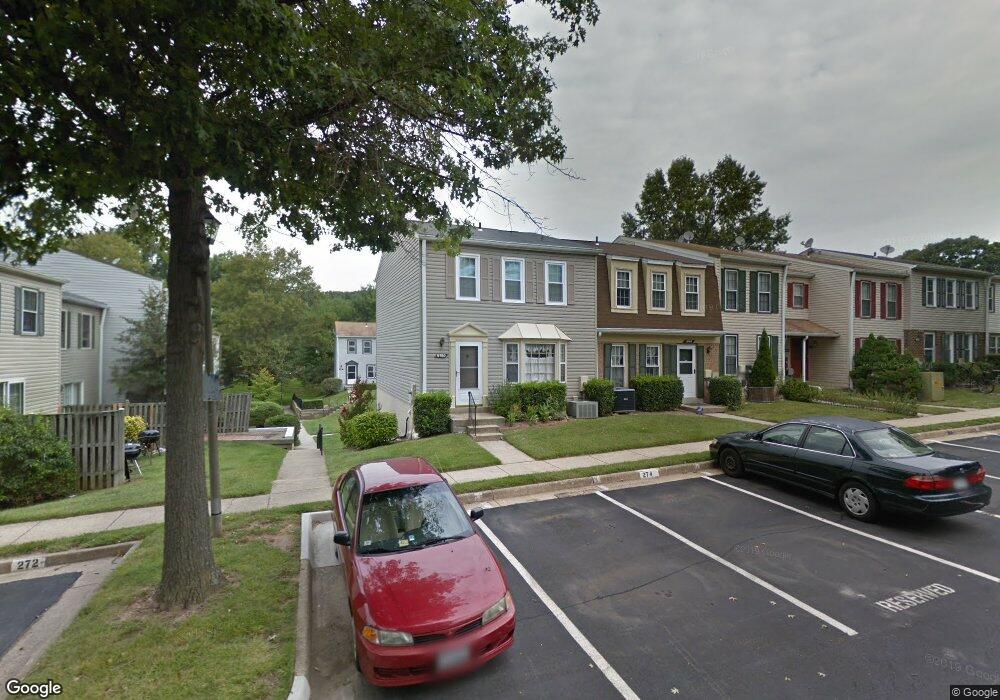
This home is located at 9150 Broken Oak Place, Burke, VA 22015 and is currently estimated at $457,011, approximately $313 per square foot. 9150 Broken Oak Place is a home located in Fairfax County with nearby schools including Lake Braddock Secondary School, Nativity Catholic School, and Sydenstricker School.
Ownership History
Date
Name
Owned For
Owner Type
Purchase Details
Closed on
Apr 30, 2025
Sold by
Harb Layla W and Harb Walid N
Bought by
Bilbao-Pando Mauricio
Current Estimated Value
Home Financials for this Owner
Home Financials are based on the most recent Mortgage that was taken out on this home.
Original Mortgage
$372,000
Outstanding Balance
$370,688
Interest Rate
6.67%
Mortgage Type
New Conventional
Estimated Equity
$86,323
Purchase Details
Closed on
Jun 22, 2018
Sold by
Reyna Johnny C and Flores Reina M
Bought by
Harb Layla W and Harb Walid N
Home Financials for this Owner
Home Financials are based on the most recent Mortgage that was taken out on this home.
Original Mortgage
$288,461
Interest Rate
4.5%
Mortgage Type
New Conventional
Create a Home Valuation Report for This Property
The Home Valuation Report is an in-depth analysis detailing your home's value as well as a comparison with similar homes in the area
Home Values in the Area
Average Home Value in this Area
Purchase History
| Date | Buyer | Sale Price | Title Company |
|---|---|---|---|
| Bilbao-Pando Mauricio | $465,000 | First American Title | |
| Bilbao-Pando Mauricio | $465,000 | First American Title | |
| Harb Layla W | $315,000 | Millennium Title & Abstract |
Source: Public Records
Mortgage History
| Date | Status | Borrower | Loan Amount |
|---|---|---|---|
| Open | Bilbao-Pando Mauricio | $372,000 | |
| Closed | Bilbao-Pando Mauricio | $372,000 | |
| Previous Owner | Harb Layla W | $288,461 |
Source: Public Records
Tax History Compared to Growth
Tax History
| Year | Tax Paid | Tax Assessment Tax Assessment Total Assessment is a certain percentage of the fair market value that is determined by local assessors to be the total taxable value of land and additions on the property. | Land | Improvement |
|---|---|---|---|---|
| 2025 | $4,455 | $403,820 | $81,000 | $322,820 |
| 2024 | $4,455 | $384,590 | $77,000 | $307,590 |
| 2023 | $4,173 | $369,800 | $74,000 | $295,800 |
| 2022 | $3,793 | $331,660 | $66,000 | $265,660 |
| 2021 | $3,672 | $312,890 | $63,000 | $249,890 |
| 2020 | $3,561 | $300,860 | $60,000 | $240,860 |
| 2019 | $3,454 | $291,870 | $59,000 | $232,870 |
| 2018 | $3,135 | $272,640 | $55,000 | $217,640 |
| 2017 | $3,073 | $264,700 | $53,000 | $211,700 |
| 2016 | $2,839 | $245,020 | $49,000 | $196,020 |
| 2015 | $2,707 | $242,590 | $49,000 | $193,590 |
| 2014 | $2,779 | $249,580 | $50,000 | $199,580 |
Source: Public Records
Map
Nearby Homes
- 6433 Fenestra Ct Unit 56B
- 6314 Draco St
- 9075 Andromeda Dr
- 6427 Old Scotts Ct
- 6200 Erman Ct
- 6465 Blarney Stone Ct
- 9239 Sand Creek Ct
- 6172 Forest Creek Ct
- 9521 Cherry Oak Ct
- 9523 Cherry Oak Ct
- 9505 Scorpio Ln
- 6606 Huntsman Blvd
- 6143 Green Hollow Ct
- 8652 Tuttle Rd
- 6403 Velliety Ln
- 6710 Red Jacket Rd
- 9515 Debra Spradlin Ct
- 5848 Kara Place
- 8674 Center Rd Unit 1
- 9715 Church Way
- 9154 Broken Oak Place
- 9148 Broken Oak Place
- 9142 Broken Oak Place
- 9156 Broken Oak Place Unit 81A
- 9156 Broken Oak Place
- 9140 Broken Oak Place Unit 83C
- 9140 Broken Oak Place
- 9144 Broken Oak Place
- 9146 Broken Oak Place Unit 82B
- 9144 Broken Oak Place Unit 82C
- 9146 Broken Oak Place
- 9152 Broken Oak Place
- 6348 Fenestra Ct
- 6348 Fenestra Ct Unit 127B
- 6344 Fenestra Ct Unit 128B
- 6346 Fenestra Ct Unit 127
- 6346 Fenestra Ct
- 6344 Fenestra Ct
- 6352 Fenestra Ct
- 6352 Fenestra Ct Unit 128A