
Estimated payment $1,621/month
Highlights
- Fruit Trees
- No HOA
- Landscaped
- Rambler Architecture
- 1 Irrigated Acre
- 1 Car Garage
About This Home
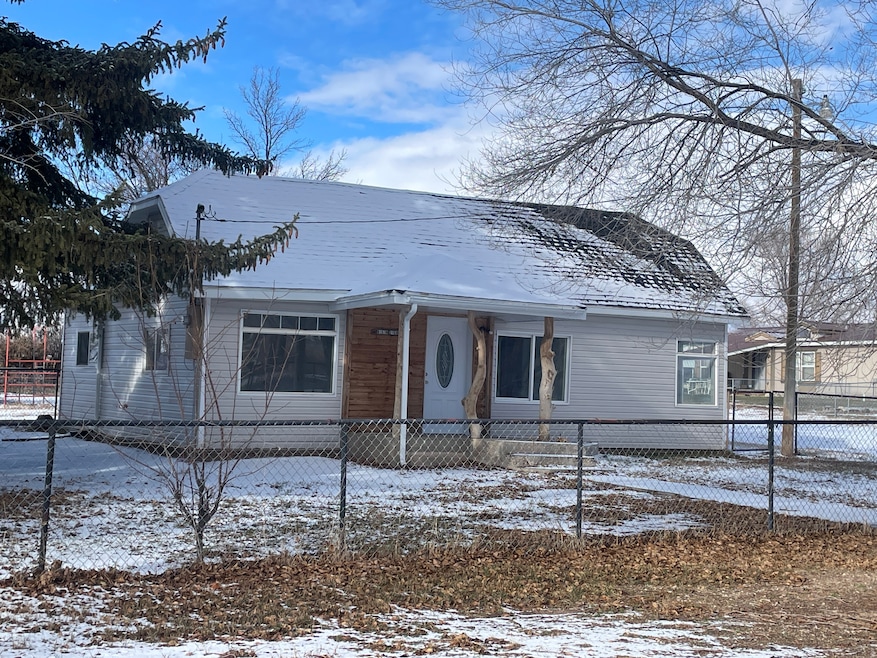
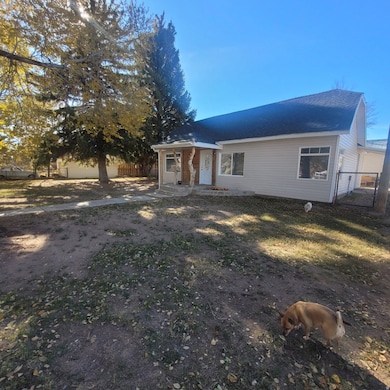
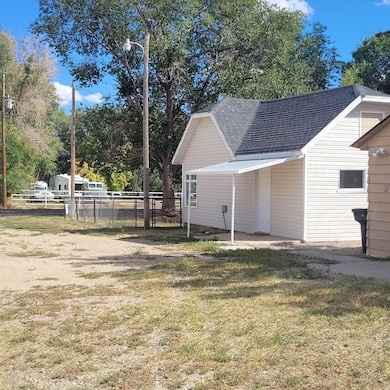
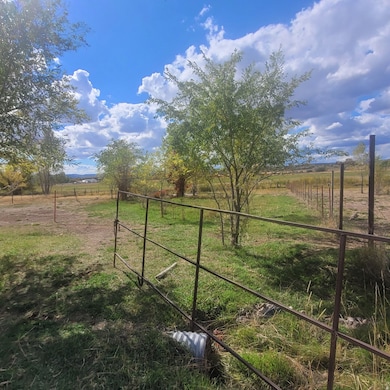
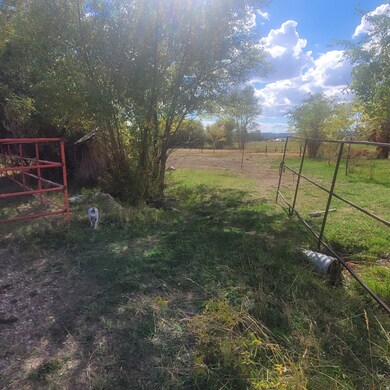
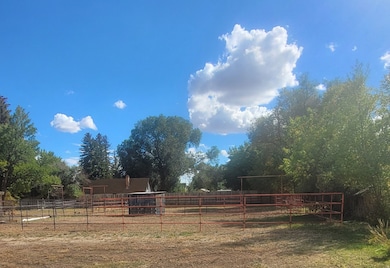
RARE FIND! Horse property in NEOLA! Charming completely renovated 2 bed 1 bath home, discover the perfect blend of comfort, charm and country living in this beautifully renovated home. Featuring a bright open layout. Situated on .81 acres the land is ready for your animal with corrals pasture and 1 share of BIA irrigation water. Mature apricot and apple trees and a detached garage with attached storage shed provide plenty of storage space for your outdoor gear. Come see this amazing property today! Buyer to verify all information.
Listing Agent
Coldwell Banker Farm and Home Realty, Inc. License #12334756 Listed on: 12/04/2025

Home Details
Home Type
- Single Family
Est. Annual Taxes
- $840
Year Built
- Built in 1927
Lot Details
- 0.8 Acre Lot
- Property is Fully Fenced
- Landscaped
- Fruit Trees
- Mature Trees
- Pine Trees
- Property is zoned Single-Family
Parking
- 1 Car Garage
- 4 Open Parking Spaces
Home Design
- Rambler Architecture
- Asphalt
Interior Spaces
- 974 Sq Ft Home
- 1-Story Property
Kitchen
- Free-Standing Range
- Microwave
Bedrooms and Bathrooms
- 2 Main Level Bedrooms
- 1 Full Bathroom
Laundry
- Dryer
- Washer
Outdoor Features
- Storage Shed
- Outbuilding
Schools
- Neola Elementary School
- Roosevelt Middle School
- Union High School
Farming
- 1 Irrigated Acre
Utilities
- No Cooling
- Heating Available
Community Details
- No Home Owners Association
Listing and Financial Details
- Assessor Parcel Number 00-0003-0928
Map
Home Values in the Area
Average Home Value in this Area
Tax History
| Year | Tax Paid | Tax Assessment Tax Assessment Total Assessment is a certain percentage of the fair market value that is determined by local assessors to be the total taxable value of land and additions on the property. | Land | Improvement |
|---|---|---|---|---|
| 2025 | $868 | $136,823 | $43,200 | $93,623 |
| 2024 | $841 | $134,028 | $43,200 | $90,828 |
| 2023 | $841 | $100,828 | $30,960 | $69,868 |
| 2022 | $593 | $83,520 | $25,800 | $57,720 |
| 2021 | $534 | $65,002 | $25,800 | $39,202 |
| 2020 | $611 | $76,281 | $25,800 | $50,481 |
| 2019 | $607 | $76,281 | $25,800 | $50,481 |
| 2018 | $766 | $93,614 | $21,000 | $72,614 |
| 2017 | $731 | $0 | $0 | $0 |
| 2016 | $724 | $0 | $0 | $0 |
| 2015 | $686 | $0 | $0 | $0 |
| 2014 | $674 | $93,614 | $21,000 | $72,614 |
| 2013 | $746 | $100,000 | $18,294 | $81,706 |
Property History
| Date | Event | Price | List to Sale | Price per Sq Ft |
|---|---|---|---|---|
| 12/04/2025 12/04/25 | For Sale | $295,000 | -- | $303 / Sq Ft |
Purchase History
| Date | Type | Sale Price | Title Company |
|---|---|---|---|
| Warranty Deed | $131,250 | Farm & Home Title Ins Agency |
Mortgage History
| Date | Status | Loan Amount | Loan Type |
|---|---|---|---|
| Open | $105,000 | Construction |
Source: UtahRealEstate.com
MLS Number: 2125570
APN: 00-0003-0928
Disclaimer: Certain information contained herein is derived from information provided by parties other than Homes.com. All information provided is deemed reliable, but is not guaranteed to be accurate and should be independently verified.
![]() IDX information is provided exclusively for consumers’ personal, non-commercial use, that it may not be used for any purpose other than to identify prospective properties consumers may be interested in purchasing, and that the data is deemed reliable but is not guaranteed accurate by the MLS. Licensor is only providing the MLS Content and not other sources of data provided in the Product.
IDX information is provided exclusively for consumers’ personal, non-commercial use, that it may not be used for any purpose other than to identify prospective properties consumers may be interested in purchasing, and that the data is deemed reliable but is not guaranteed accurate by the MLS. Licensor is only providing the MLS Content and not other sources of data provided in the Product.
Based on information from the Wasatch Front Regional Multiple Listing Service, Inc.. All data, including all measurements and calculations of area, is obtained from various sources and has not been, and will not be, verified by broker or the MLS. All information should be independently reviewed and verified for accuracy. Properties may or may not be listed by the office/agent presenting the information.
- 2192 W 9000 N
- 3895 W 9000 N Unit 1,2,3,
- 3460 W 9000 N Unit 4
- 9765 N Uintah Canyon Hwy
- 2560 W 2000 S Unit 6
- 2640 W 2000 S Unit 4
- 2600 W 2000 S Unit 5
- 874 N 3500 E
- 1 W 5600 N
- 3249 E 7000 N
- 7374 N 3250 W
- 979 N 3650 W Unit B
- 8750 W 6000 N
- 5900 W 6000 N
- 3390 W 5000 N
- 8750 6000 W
- 6250 W 6600 N
- 9181 N 9183 N 2160 W
- 4491 N 3000 W
- 5104 W 5550 N