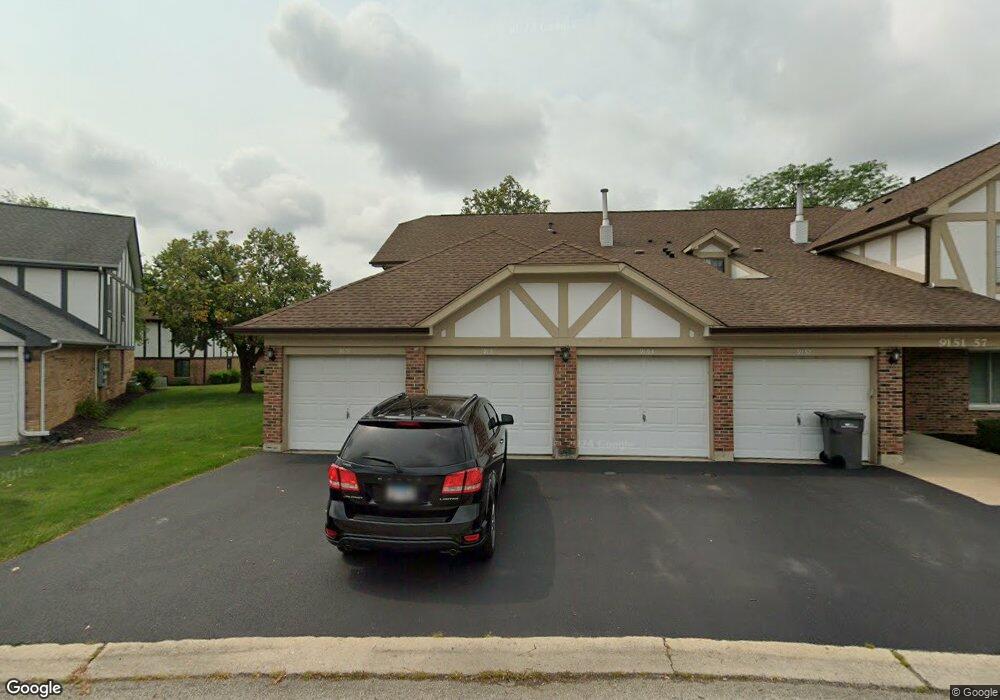
9151 Sutton Ct Unit 93 Orland Park, IL 60462
Central Orland NeighborhoodEstimated Value: $220,232 - $261,000
2
Beds
1
Bath
1,200
Sq Ft
$198/Sq Ft
Est. Value
About This Home
This home is located at 9151 Sutton Ct Unit 93, Orland Park, IL 60462 and is currently estimated at $237,058, approximately $197 per square foot. 9151 Sutton Ct Unit 93 is a home located in Cook County with nearby schools including Prairie Elementary School, Liberty Elementary School, and Jerling Junior High School.
Ownership History
Date
Name
Owned For
Owner Type
Purchase Details
Closed on
Sep 24, 2013
Sold by
Goggin Kevin
Bought by
Goggin Jennifer
Current Estimated Value
Purchase Details
Closed on
Mar 25, 2010
Sold by
Lawler Dawn M
Bought by
Goggin Kevin and Meyer Jennifer
Home Financials for this Owner
Home Financials are based on the most recent Mortgage that was taken out on this home.
Original Mortgage
$149,246
Outstanding Balance
$101,453
Interest Rate
5.5%
Mortgage Type
FHA
Estimated Equity
$135,605
Purchase Details
Closed on
Jun 22, 2005
Sold by
Lawler Robert W
Bought by
Lawler Robert L
Home Financials for this Owner
Home Financials are based on the most recent Mortgage that was taken out on this home.
Original Mortgage
$85,000
Interest Rate
5.71%
Mortgage Type
New Conventional
Create a Home Valuation Report for This Property
The Home Valuation Report is an in-depth analysis detailing your home's value as well as a comparison with similar homes in the area
Home Values in the Area
Average Home Value in this Area
Purchase History
| Date | Buyer | Sale Price | Title Company |
|---|---|---|---|
| Goggin Jennifer | -- | None Available | |
| Goggin Kevin | $152,000 | Cti | |
| Lawler Robert L | -- | Ticor Title |
Source: Public Records
Mortgage History
| Date | Status | Borrower | Loan Amount |
|---|---|---|---|
| Open | Goggin Kevin | $149,246 | |
| Previous Owner | Lawler Robert L | $85,000 |
Source: Public Records
Tax History Compared to Growth
Tax History
| Year | Tax Paid | Tax Assessment Tax Assessment Total Assessment is a certain percentage of the fair market value that is determined by local assessors to be the total taxable value of land and additions on the property. | Land | Improvement |
|---|---|---|---|---|
| 2024 | $3,174 | $15,999 | $2,278 | $13,721 |
| 2023 | $2,764 | $15,999 | $2,278 | $13,721 |
| 2022 | $2,764 | $12,648 | $2,004 | $10,644 |
| 2021 | $2,695 | $12,647 | $2,004 | $10,643 |
| 2020 | $2,658 | $12,647 | $2,004 | $10,643 |
| 2019 | $2,347 | $11,979 | $1,822 | $10,157 |
| 2018 | $2,281 | $11,979 | $1,822 | $10,157 |
| 2017 | $2,245 | $11,979 | $1,822 | $10,157 |
| 2016 | $2,184 | $10,323 | $1,639 | $8,684 |
| 2015 | $2,128 | $10,323 | $1,639 | $8,684 |
| 2014 | $2,111 | $10,323 | $1,639 | $8,684 |
| 2013 | $3,152 | $12,299 | $1,639 | $10,660 |
Source: Public Records
Map
Nearby Homes
- 9148 Clairmont Ct Unit 120
- 8944 Fernwood Ct
- 9061 Somerset Ct Unit 16
- 14759 Montgomery Dr
- 14746 Lakeview Dr
- 9205 Lake View Dr
- 9180 136th St
- 9048 W 147th St
- 14739 Maple Ave
- 9055 Fairway Dr
- 14641 Birch St
- 56 Orland Square Dr
- 14610 Birch St
- 14656 Green St
- 14602 Beech St
- 14712 S 88th Ave
- 14540 Birch St
- 15324 Regent Dr
- 15336 Regent Dr
- 14440 Brentwood St
- 9153 Sutton Ct Unit 94
- 9155 Sutton Ct Unit 95
- 9157 Sutton Ct Unit 96
- 9157 Sutton Ct Unit 9143
- 9145 Sutton Ct Unit 91
- 9145 Sutton Ct Unit 9145
- 9161 Sutton Ct Unit 97
- 9163 Sutton Ct Unit 98
- 9143 Sutton Ct Unit 90
- 9165 Sutton Ct Unit 99
- 9141 Sutton Ct Unit 89
- 9167 Sutton Ct Unit 100
- 9147 Sutton Ct Unit 92
- 9135 Sutton Ct Unit 87
- 9135 Sutton Ct Unit 2B
- 9136 Sutton Ct Unit 103
- 9138 Fairmont Ct Unit 76
- 9137 Sutton Ct Unit 88
- 9132 Sutton Ct Unit 101
- 9127 Sutton Ct Unit 84