9154 Arnold Redford, MI 48239
Estimated Value: $179,826 - $214,000
3
Beds
2
Baths
1,050
Sq Ft
$188/Sq Ft
Est. Value
About This Home
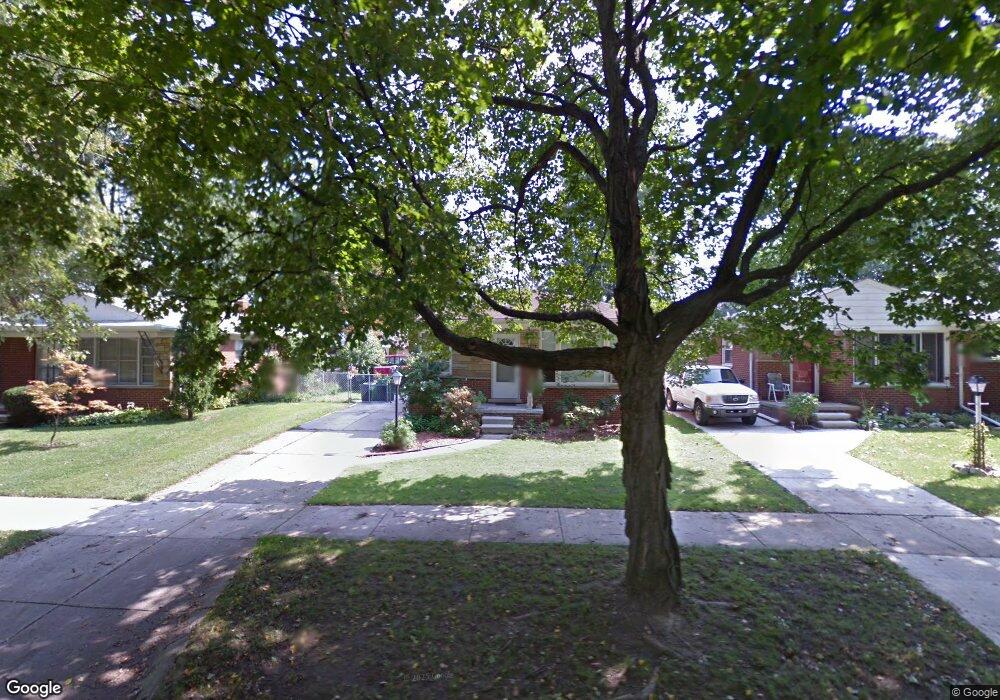
This home is located at 9154 Arnold, Redford, MI 48239 and is currently estimated at $197,457, approximately $188 per square foot. 9154 Arnold is a home located in Wayne County with nearby schools including John D. Pierce Middle School, Lee M. Thurston High School, and Global Heights Academy.
Ownership History
Date
Name
Owned For
Owner Type
Purchase Details
Closed on
Jul 2, 2009
Sold by
Chase Asset Management Llc
Bought by
Dab Property Llc
Current Estimated Value
Purchase Details
Closed on
Jul 24, 2008
Sold by
Mortgage Electronic Registration Systems
Bought by
Us Bank Na and Jp Morgan Mortgage Acquisition Trust 200
Purchase Details
Closed on
Jul 16, 2008
Sold by
Nicklay Chris and Nicklay Colleen
Bought by
Mortgage Electronic Registration Systems
Purchase Details
Closed on
Jun 12, 2003
Sold by
Kies Robert L
Bought by
Nicklay Christopher G
Create a Home Valuation Report for This Property
The Home Valuation Report is an in-depth analysis detailing your home's value as well as a comparison with similar homes in the area
Home Values in the Area
Average Home Value in this Area
Purchase History
| Date | Buyer | Sale Price | Title Company |
|---|---|---|---|
| Dab Property Llc | $19,000 | Complete Title Services Of S | |
| Us Bank Na | -- | None Available | |
| Mortgage Electronic Registration Systems | $122,700 | None Available | |
| Nicklay Christopher G | $119,000 | American Titleworks |
Source: Public Records
Tax History Compared to Growth
Tax History
| Year | Tax Paid | Tax Assessment Tax Assessment Total Assessment is a certain percentage of the fair market value that is determined by local assessors to be the total taxable value of land and additions on the property. | Land | Improvement |
|---|---|---|---|---|
| 2025 | $850 | $72,700 | $0 | $0 |
| 2024 | $850 | $67,000 | $0 | $0 |
| 2023 | $813 | $59,900 | $0 | $0 |
| 2022 | $2,189 | $53,600 | $0 | $0 |
| 2021 | $2,125 | $51,000 | $0 | $0 |
| 2020 | $2,097 | $43,600 | $0 | $0 |
| 2019 | $2,054 | $39,300 | $0 | $0 |
| 2018 | $725 | $33,300 | $0 | $0 |
| 2017 | $2,200 | $31,400 | $0 | $0 |
| 2016 | $1,800 | $30,800 | $0 | $0 |
| 2015 | $2,183 | $28,300 | $0 | $0 |
| 2013 | $2,480 | $25,300 | $0 | $0 |
| 2012 | $2,132 | $27,700 | $7,200 | $20,500 |
Source: Public Records
Map
Nearby Homes