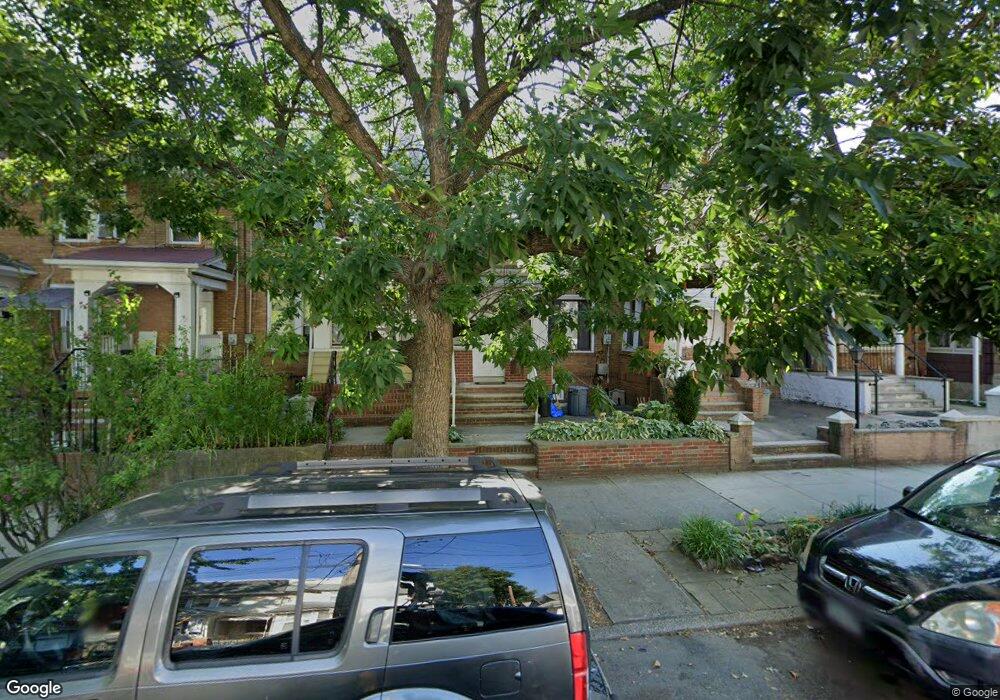
9156 96th St Woodhaven, NY 11421
Woodhaven NeighborhoodEstimated Value: $668,553 - $742,000
--
Bed
--
Bath
1,268
Sq Ft
$550/Sq Ft
Est. Value
About This Home
This home is located at 9156 96th St, Woodhaven, NY 11421 and is currently estimated at $697,388, approximately $549 per square foot. 9156 96th St is a home located in Queens County with nearby schools including P.S. 273, Jhs 210 Elizabeth Blackwell, and Richmond Hill High School.
Ownership History
Date
Name
Owned For
Owner Type
Purchase Details
Closed on
Feb 21, 2024
Sold by
Li Xiang Lian and Tu Wei
Bought by
Li Xiang Lian and Tu Xiao Ping
Current Estimated Value
Purchase Details
Closed on
May 15, 2015
Sold by
Kendall Raymond
Bought by
Li Xiang Lian and Tu Wei
Home Financials for this Owner
Home Financials are based on the most recent Mortgage that was taken out on this home.
Original Mortgage
$292,000
Outstanding Balance
$224,701
Interest Rate
3.65%
Mortgage Type
New Conventional
Estimated Equity
$472,687
Create a Home Valuation Report for This Property
The Home Valuation Report is an in-depth analysis detailing your home's value as well as a comparison with similar homes in the area
Home Values in the Area
Average Home Value in this Area
Purchase History
| Date | Buyer | Sale Price | Title Company |
|---|---|---|---|
| Li Xiang Lian | -- | -- | |
| Li Xiang Lian | -- | -- | |
| Li Xiang Lian | $365,000 | -- | |
| Li Xiang Lian | $365,000 | -- |
Source: Public Records
Mortgage History
| Date | Status | Borrower | Loan Amount |
|---|---|---|---|
| Open | Li Xiang Lian | $292,000 | |
| Closed | Li Xiang Lian | $292,000 |
Source: Public Records
Tax History Compared to Growth
Tax History
| Year | Tax Paid | Tax Assessment Tax Assessment Total Assessment is a certain percentage of the fair market value that is determined by local assessors to be the total taxable value of land and additions on the property. | Land | Improvement |
|---|---|---|---|---|
| 2025 | $5,597 | $29,539 | $7,590 | $21,949 |
| 2024 | $5,597 | $27,868 | $8,461 | $19,407 |
| 2023 | $5,471 | $27,238 | $8,269 | $18,969 |
| 2022 | $5,130 | $39,720 | $11,640 | $28,080 |
| 2021 | $5,408 | $34,380 | $11,640 | $22,740 |
| 2020 | $5,210 | $33,720 | $11,640 | $22,080 |
| 2019 | $4,858 | $34,560 | $11,640 | $22,920 |
| 2018 | $4,627 | $22,698 | $8,807 | $13,891 |
| 2017 | $4,365 | $21,414 | $9,130 | $12,284 |
| 2016 | $4,281 | $21,414 | $9,130 | $12,284 |
| 2015 | $2,084 | $20,514 | $10,917 | $9,597 |
| 2014 | $2,084 | $19,353 | $10,561 | $8,792 |
Source: Public Records
Map
Nearby Homes