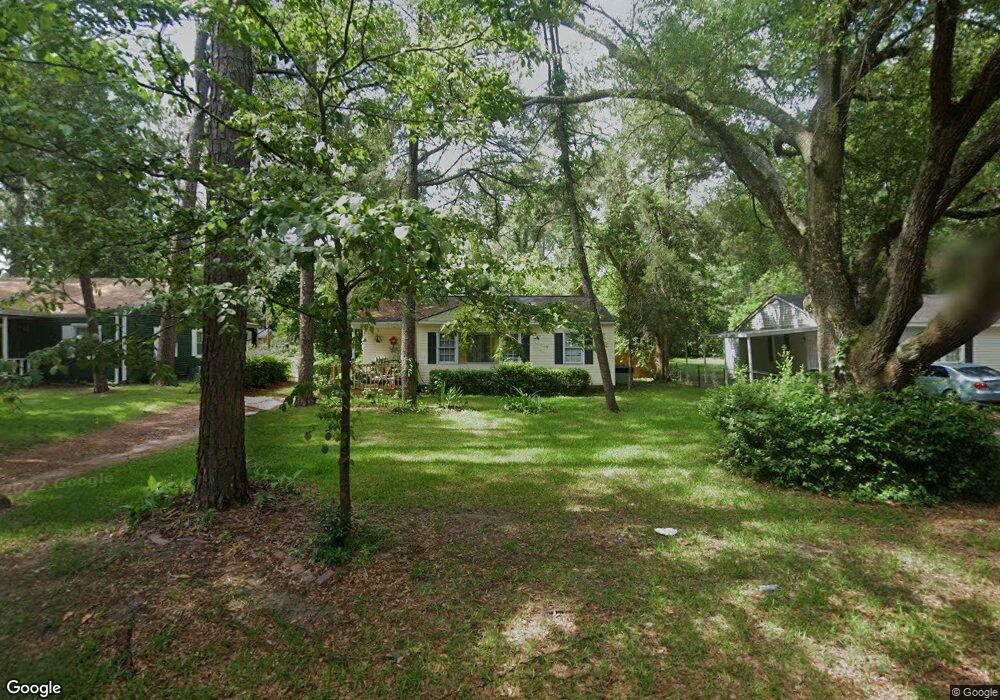
916 10th Ave Albany, GA 31701
Rawson Park NeighborhoodEstimated Value: $72,102 - $93,000
3
Beds
1
Bath
962
Sq Ft
$88/Sq Ft
Est. Value
About This Home
This home is located at 916 10th Ave, Albany, GA 31701 and is currently estimated at $84,526, approximately $87 per square foot. 916 10th Ave is a home located in Dougherty County with nearby schools including Northside Elementary School, Albany Middle School, and Albany High School.
Ownership History
Date
Name
Owned For
Owner Type
Purchase Details
Closed on
Feb 27, 2012
Sold by
Willcox Properties Llc
Bought by
Shipp Stephanie
Current Estimated Value
Purchase Details
Closed on
Feb 26, 2001
Sold by
Webb Jeffrey A
Bought by
Willcox Properties Llc A Ga Limited Liab
Purchase Details
Closed on
Sep 30, 1997
Sold by
Wilson Marcella Marie
Bought by
Webb Jeffrey A
Purchase Details
Closed on
Aug 2, 1996
Sold by
Gilley Melvin J
Bought by
Wilson Marcella Marie
Purchase Details
Closed on
Apr 25, 1996
Sold by
Chastain Marie Agnes By Co-Exec U/Will
Bought by
Gilley Melvin J
Purchase Details
Closed on
Jul 13, 1993
Sold by
R Chastain C and R J
Bought by
Chastain Marie Agnes
Purchase Details
Closed on
Jan 29, 1992
Sold by
Nobles Martha L
Bought by
Chastain Chastain C and Chastain Obt J
Purchase Details
Closed on
Feb 3, 1964
Sold by
Lamm Lamm and Lamm Johnson
Bought by
Nobles Martha
Create a Home Valuation Report for This Property
The Home Valuation Report is an in-depth analysis detailing your home's value as well as a comparison with similar homes in the area
Home Values in the Area
Average Home Value in this Area
Purchase History
| Date | Buyer | Sale Price | Title Company |
|---|---|---|---|
| Shipp Stephanie | $53,000 | -- | |
| Willcox Properties Llc A Ga Limited Liab | $44,000 | -- | |
| Webb Jeffrey A | $42,000 | -- | |
| Wilson Marcella Marie | $39,000 | -- | |
| Gilley Melvin J | $29,000 | -- | |
| Chastain Marie Agnes | -- | -- | |
| Chastain Chastain C | $30,000 | -- | |
| Nobles Martha | -- | -- |
Source: Public Records
Tax History Compared to Growth
Tax History
| Year | Tax Paid | Tax Assessment Tax Assessment Total Assessment is a certain percentage of the fair market value that is determined by local assessors to be the total taxable value of land and additions on the property. | Land | Improvement |
|---|---|---|---|---|
| 2024 | $807 | $18,920 | $6,480 | $12,440 |
| 2023 | $0 | $18,920 | $6,480 | $12,440 |
| 2022 | $791 | $18,920 | $6,480 | $12,440 |
| 2021 | $734 | $18,920 | $6,480 | $12,440 |
| 2020 | $735 | $18,920 | $6,480 | $12,440 |
| 2019 | $738 | $18,920 | $6,480 | $12,440 |
| 2018 | $741 | $18,920 | $6,480 | $12,440 |
| 2017 | $690 | $18,920 | $6,480 | $12,440 |
| 2016 | $691 | $18,920 | $6,480 | $12,440 |
| 2015 | $775 | $18,920 | $6,480 | $12,440 |
| 2014 | $765 | $18,920 | $6,480 | $12,440 |
Source: Public Records
Map
Nearby Homes