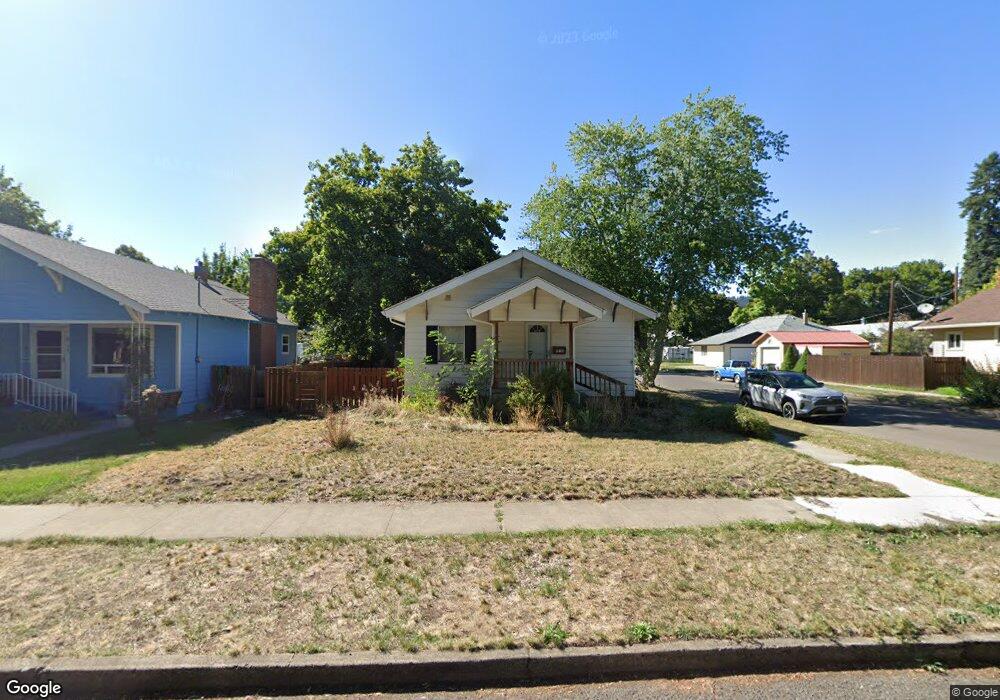
916 14th St La Grande, OR 97850
Estimated Value: $248,000 - $270,174
2
Beds
1
Bath
1,598
Sq Ft
$162/Sq Ft
Est. Value
About This Home
This home is located at 916 14th St, La Grande, OR 97850 and is currently estimated at $259,087, approximately $162 per square foot. 916 14th St is a home located in Union County with nearby schools including La Grande High School, The Marian Academy, and Grande Ronde Academy.
Ownership History
Date
Name
Owned For
Owner Type
Purchase Details
Closed on
Nov 12, 2014
Sold by
National Residential Nominee Services In
Bought by
Cain Shaun
Current Estimated Value
Home Financials for this Owner
Home Financials are based on the most recent Mortgage that was taken out on this home.
Original Mortgage
$125,190
Interest Rate
4.75%
Mortgage Type
FHA
Purchase Details
Closed on
May 14, 2009
Sold by
Ferguson Chancy L
Bought by
Clifton Shane D
Home Financials for this Owner
Home Financials are based on the most recent Mortgage that was taken out on this home.
Original Mortgage
$137,755
Interest Rate
4.8%
Mortgage Type
New Conventional
Purchase Details
Closed on
Aug 29, 2005
Sold by
Dyson Gregory J and Dyson Mary E
Bought by
Ferguson Chancy L
Home Financials for this Owner
Home Financials are based on the most recent Mortgage that was taken out on this home.
Original Mortgage
$107,610
Interest Rate
5.64%
Mortgage Type
New Conventional
Create a Home Valuation Report for This Property
The Home Valuation Report is an in-depth analysis detailing your home's value as well as a comparison with similar homes in the area
Home Values in the Area
Average Home Value in this Area
Purchase History
| Date | Buyer | Sale Price | Title Company |
|---|---|---|---|
| Cain Shaun | $107,500 | None Available | |
| Clifton Shane D | $135,000 | Atco | |
| Ferguson Chancy L | $105,500 | None Available |
Source: Public Records
Mortgage History
| Date | Status | Borrower | Loan Amount |
|---|---|---|---|
| Previous Owner | Cain Shaun | $125,190 | |
| Previous Owner | Clifton Shane D | $137,755 | |
| Previous Owner | Ferguson Chancy L | $107,610 |
Source: Public Records
Tax History Compared to Growth
Tax History
| Year | Tax Paid | Tax Assessment Tax Assessment Total Assessment is a certain percentage of the fair market value that is determined by local assessors to be the total taxable value of land and additions on the property. | Land | Improvement |
|---|---|---|---|---|
| 2024 | $2,311 | $128,360 | $49,470 | $78,890 |
| 2023 | $2,270 | $124,630 | $48,030 | $76,600 |
| 2022 | $2,210 | $121,006 | $46,634 | $74,372 |
| 2021 | $2,154 | $117,482 | $45,651 | $71,831 |
| 2020 | $2,067 | $114,061 | $44,353 | $69,708 |
| 2019 | $2,024 | $110,739 | $43,190 | $67,549 |
| 2018 | $1,970 | $107,514 | $38,697 | $68,817 |
| 2017 | $1,914 | $104,383 | $37,857 | $66,526 |
| 2016 | $1,857 | $101,343 | $36,854 | $64,489 |
| 2015 | $1,790 | $98,392 | $35,830 | $62,562 |
| 2014 | $1,555 | $95,527 | $34,868 | $60,659 |
| 2013 | -- | $92,745 | $33,827 | $58,918 |
Source: Public Records
Map
Nearby Homes