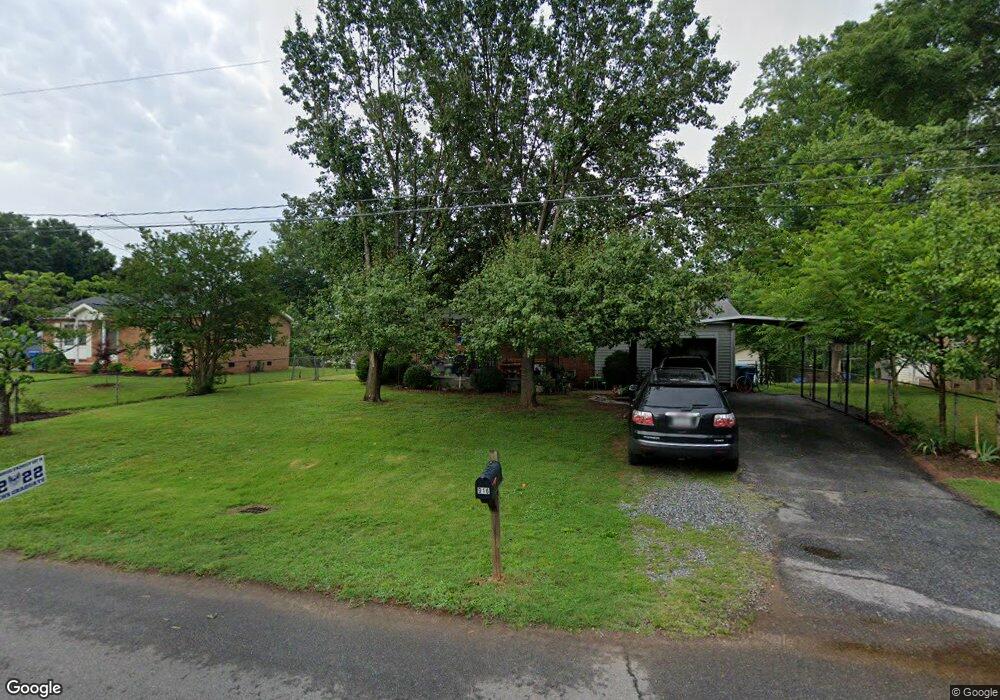
916 32nd St NE Conover, NC 28613
Estimated Value: $204,000 - $260,000
2
Beds
1
Bath
1,400
Sq Ft
$158/Sq Ft
Est. Value
About This Home
This home is located at 916 32nd St NE, Conover, NC 28613 and is currently estimated at $221,013, approximately $157 per square foot. 916 32nd St NE is a home located in Catawba County with nearby schools including Saint Stephens Elementary School, Saint Stephens High School, and Harry M. Arndt Middle School.
Ownership History
Date
Name
Owned For
Owner Type
Purchase Details
Closed on
Apr 29, 2016
Sold by
Johnson Karri W and Johnson Patrick L
Bought by
Johnson Homes Rentals Llc
Current Estimated Value
Purchase Details
Closed on
Feb 10, 2012
Sold by
Johnson Karri W
Bought by
Johnson Patrick L and Johnson Karri W
Home Financials for this Owner
Home Financials are based on the most recent Mortgage that was taken out on this home.
Original Mortgage
$62,000
Interest Rate
3.15%
Mortgage Type
New Conventional
Purchase Details
Closed on
Oct 5, 2006
Sold by
Wood Mark R and Wood Michele E
Bought by
Johnson Karri W
Home Financials for this Owner
Home Financials are based on the most recent Mortgage that was taken out on this home.
Original Mortgage
$65,250
Interest Rate
6.46%
Mortgage Type
Purchase Money Mortgage
Purchase Details
Closed on
Apr 1, 1999
Create a Home Valuation Report for This Property
The Home Valuation Report is an in-depth analysis detailing your home's value as well as a comparison with similar homes in the area
Home Values in the Area
Average Home Value in this Area
Purchase History
| Date | Buyer | Sale Price | Title Company |
|---|---|---|---|
| Johnson Homes Rentals Llc | -- | Attorney | |
| Johnson Patrick L | -- | None Available | |
| Johnson Karri W | $87,000 | None Available | |
| -- | $68,000 | -- |
Source: Public Records
Mortgage History
| Date | Status | Borrower | Loan Amount |
|---|---|---|---|
| Previous Owner | Johnson Patrick L | $62,000 | |
| Previous Owner | Johnson Karri W | $65,250 |
Source: Public Records
Tax History
| Year | Tax Paid | Tax Assessment Tax Assessment Total Assessment is a certain percentage of the fair market value that is determined by local assessors to be the total taxable value of land and additions on the property. | Land | Improvement |
|---|---|---|---|---|
| 2025 | $990 | $189,500 | $8,400 | $181,100 |
| 2024 | $990 | $189,500 | $8,400 | $181,100 |
| 2023 | $952 | $189,500 | $8,400 | $181,100 |
| 2022 | $692 | $99,500 | $8,400 | $91,100 |
| 2021 | $692 | $99,500 | $8,400 | $91,100 |
| 2020 | $692 | $99,500 | $0 | $0 |
| 2019 | $692 | $99,500 | $0 | $0 |
| 2018 | $564 | $81,200 | $8,100 | $73,100 |
| 2017 | $564 | $0 | $0 | $0 |
| 2016 | $564 | $0 | $0 | $0 |
| 2015 | $496 | $81,170 | $8,100 | $73,070 |
| 2014 | $496 | $82,700 | $9,200 | $73,500 |
Source: Public Records
Map
Nearby Homes
- 952 30th St NE
- 1109 34th Street Ln NE
- 1212 31st St NE
- 1302 31st St NE
- 1249 30th Street Ln NE
- 1276 30th Street Ln NE
- 1265 30th Street Ln NE
- 1284 30th Street Ln NE
- 1292 30th Street Ln NE
- 1273 30th Street Ln NE
- 1300 30th Street Ln NE
- 1289 30th Street Ln NE
- 1308 30th Street Ln NE
- 1305 30th Street Ln NE
- 1313 30th Street Ln NE
- 1321 30th Street Ln NE
- 1524 31st St NE
- 1530 29th St SE
- 1524 29th St SE
- 2761 Highland Ave NE
- 926 32nd St NE
- 908 32nd St NE
- 932 32nd St NE
- Lot 10/C 32nd Street Dr NE
- 909 32nd St NE
- 918 32nd Street Dr NE
- 910 32nd Street Dr NE
- LOT 21 AND 22 32nd Street Dr NE
- Lots 21-22 32nd Street Dr NE Unit 21-22 / D
- Lot 32nd Street Dr NE Unit 23
- Lots 32nd Street Dr NE Unit 13,15, 21-23 / D
- Lots 21-23 32nd Street Dr NE Unit 21-23 / D
- 917 32nd St NE
- 834 32nd St NE
- 926 32nd Street Dr NE
- 940 32nd St NE
- 211 9th Avenue Ct NE Unit 83
- 934 32nd Street Dr NE
- 935 32nd St NE
- 824 32nd St NE
Your Personal Tour Guide
Ask me questions while you tour the home.