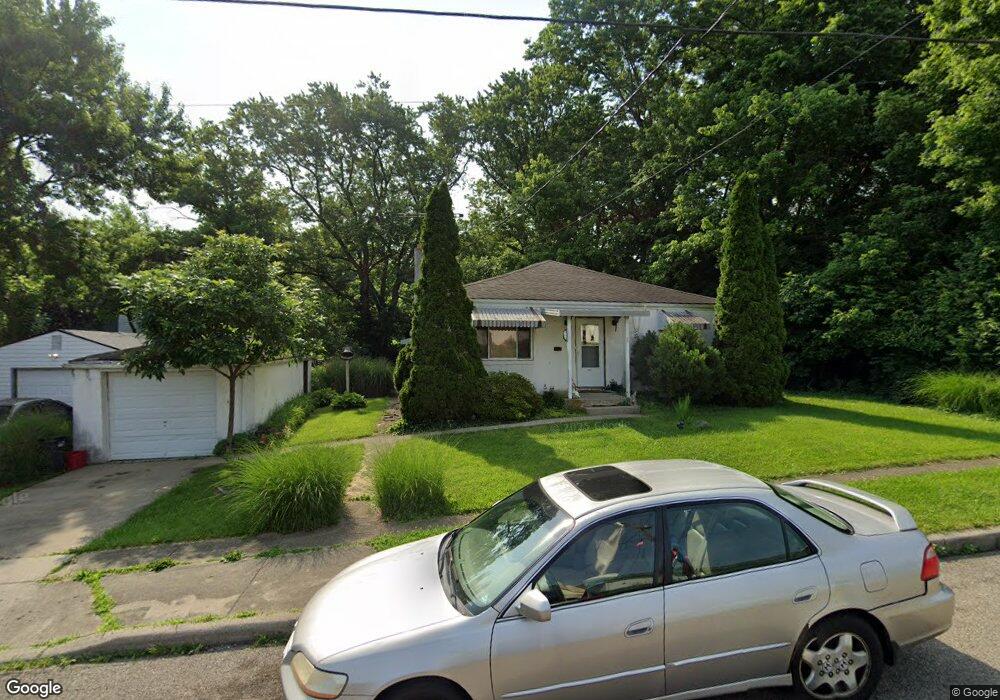
916 4th St Cincinnati, OH 45215
Estimated Value: $172,371 - $243,000
3
Beds
1
Bath
1,488
Sq Ft
$140/Sq Ft
Est. Value
About This Home
This home is located at 916 4th St, Cincinnati, OH 45215 and is currently estimated at $208,593, approximately $140 per square foot. 916 4th St is a home located in Hamilton County with nearby schools including Reading Community High School, Saints Peter and Paul Academy, and Mount Notre Dame High School.
Ownership History
Date
Name
Owned For
Owner Type
Purchase Details
Closed on
Dec 5, 1994
Sold by
Corsmeier Richard C and Ambrose Mary Kay
Bought by
Hughes George Allen and Hughes Kelly Anne
Current Estimated Value
Home Financials for this Owner
Home Financials are based on the most recent Mortgage that was taken out on this home.
Original Mortgage
$71,250
Interest Rate
9.06%
Purchase Details
Closed on
Nov 29, 1993
Sold by
Corsmeier Elmer J and Corsmeier Cecilia J
Bought by
Corsmeier Richard C and Ambrose Mary Kay
Create a Home Valuation Report for This Property
The Home Valuation Report is an in-depth analysis detailing your home's value as well as a comparison with similar homes in the area
Home Values in the Area
Average Home Value in this Area
Purchase History
| Date | Buyer | Sale Price | Title Company |
|---|---|---|---|
| Hughes George Allen | -- | -- | |
| Corsmeier Richard C | -- | -- |
Source: Public Records
Mortgage History
| Date | Status | Borrower | Loan Amount |
|---|---|---|---|
| Closed | Hughes George Allen | $71,250 |
Source: Public Records
Tax History
| Year | Tax Paid | Tax Assessment Tax Assessment Total Assessment is a certain percentage of the fair market value that is determined by local assessors to be the total taxable value of land and additions on the property. | Land | Improvement |
|---|---|---|---|---|
| 2025 | $2,179 | $41,056 | $10,350 | $30,706 |
| 2024 | $2,131 | $41,056 | $10,350 | $30,706 |
| 2023 | $2,161 | $41,056 | $10,350 | $30,706 |
| 2022 | $2,019 | $29,729 | $8,323 | $21,406 |
| 2021 | $1,688 | $29,729 | $8,323 | $21,406 |
| 2020 | $1,704 | $29,729 | $8,323 | $21,406 |
| 2019 | $1,652 | $26,306 | $7,364 | $18,942 |
| 2018 | $1,653 | $26,306 | $7,364 | $18,942 |
| 2017 | $1,560 | $26,306 | $7,364 | $18,942 |
| 2016 | $2,005 | $33,695 | $7,805 | $25,890 |
| 2015 | $2,018 | $33,695 | $7,805 | $25,890 |
| 2014 | $1,767 | $33,695 | $7,805 | $25,890 |
| 2013 | $1,781 | $34,381 | $7,963 | $26,418 |
Source: Public Records
Map
Nearby Homes
- 310 E Vine St
- 654 3rd St
- 0 Hill St Unit 1616370
- 129 Pike St
- 134 Walnut St
- 1521 Hunt Rd
- 653 Harmes Ave
- 636 Maple Dr
- 311 Southern Ave
- 2148 Julie Terrace
- 1401 Jefferson Ave
- 329 Walnut St
- 2113 Bolser Dr
- 321 Southern Ave
- 1421 Jefferson Ave
- 234 Mcguire Ln
- 54 Gorman Ln
- 9350 Reading Rd
- 18 Gahl Terrace
- 26 Gahl Terrace
Your Personal Tour Guide
Ask me questions while you tour the home.