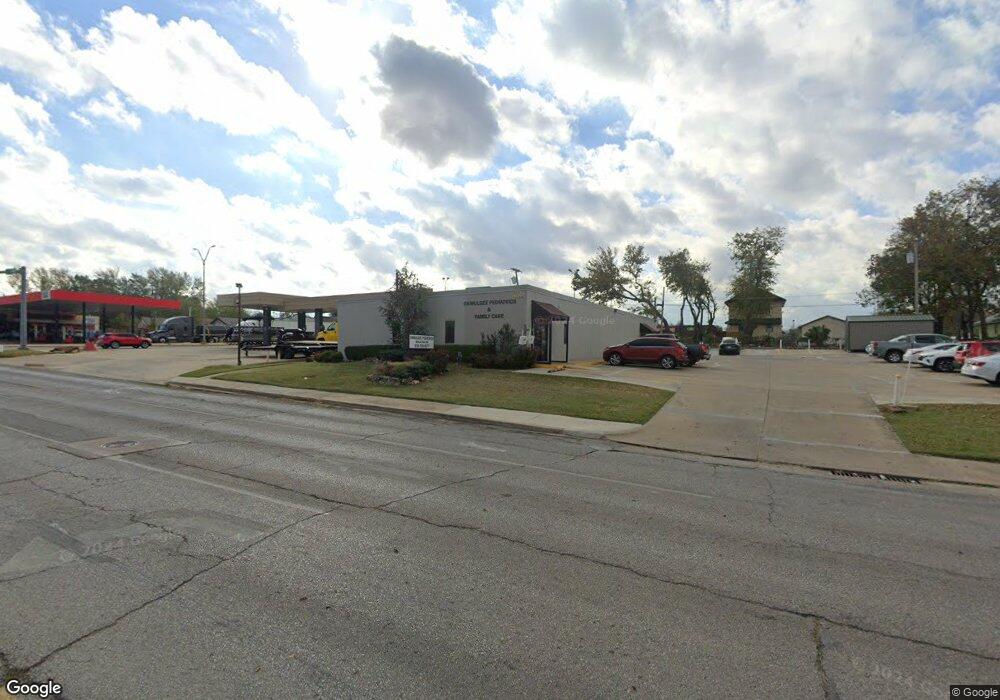
916 E 8th St Okmulgee, OK 74447
Estimated Value: $443,438
Studio
--
Bath
7,420
Sq Ft
$60/Sq Ft
Est. Value
About This Home
This home is located at 916 E 8th St, Okmulgee, OK 74447 and is currently estimated at $443,438, approximately $59 per square foot. 916 E 8th St is a home located in Okmulgee County with nearby schools including Okmulgee Primary School, Dunbar Elementary School, and Okmulgee Middle School.
Ownership History
Date
Name
Owned For
Owner Type
Purchase Details
Closed on
Mar 31, 2020
Sold by
Rhoades C David
Bought by
Sher Properties Llc
Current Estimated Value
Purchase Details
Closed on
Jan 29, 2020
Sold by
Burton & Associates Llc
Bought by
Sher Properties Llc
Purchase Details
Closed on
Nov 7, 2017
Sold by
Rhodes C David
Bought by
Burton Associates
Home Financials for this Owner
Home Financials are based on the most recent Mortgage that was taken out on this home.
Original Mortgage
$168,000
Interest Rate
3.91%
Mortgage Type
Commercial
Create a Home Valuation Report for This Property
The Home Valuation Report is an in-depth analysis detailing your home's value as well as a comparison with similar homes in the area
Home Values in the Area
Average Home Value in this Area
Purchase History
| Date | Buyer | Sale Price | Title Company |
|---|---|---|---|
| Sher Properties Llc | -- | None Available | |
| Sher Properties Llc | $295,000 | Elite Title Services | |
| Burton Associates | $210,000 | Elite Title Services |
Source: Public Records
Mortgage History
| Date | Status | Borrower | Loan Amount |
|---|---|---|---|
| Previous Owner | Burton Associates | $168,000 |
Source: Public Records
Tax History
| Year | Tax Paid | Tax Assessment Tax Assessment Total Assessment is a certain percentage of the fair market value that is determined by local assessors to be the total taxable value of land and additions on the property. | Land | Improvement |
|---|---|---|---|---|
| 2025 | $1,778 | $19,400 | $2,438 | $16,962 |
| 2024 | $1,673 | $18,477 | $2,322 | $16,155 |
| 2023 | $2,366 | $27,783 | $2,322 | $25,461 |
| 2022 | $2,237 | $26,460 | $2,322 | $24,138 |
| 2021 | $2,228 | $26,460 | $2,322 | $24,138 |
| 2020 | $2,123 | $24,000 | $2,322 | $21,678 |
| 2019 | $2,172 | $24,600 | $2,322 | $22,278 |
| 2018 | $2,255 | $25,200 | $2,322 | $22,878 |
| 2017 | $1,918 | $21,662 | $2,322 | $19,340 |
| 2016 | $1,923 | $21,662 | $2,322 | $19,340 |
| 2015 | $1,865 | $21,663 | $2,217 | $19,446 |
| 2014 | $1,788 | $20,630 | $1,978 | $18,652 |
Source: Public Records
Map
Nearby Homes
- 911 E 9th St
- 320 S Wood Dr
- 901 E 9th E Hwy 75 St Unit 901
- 1009 E 8th St
- 918 E 7th St
- 706 S Choctaw Ave
- 900 E 7th St
- 200 S Wood Dr
- 1013 E 9th St
- 1002 E 9th St
- 1017 E 9th St
- 1010 E 9th St
- 200 S Choctaw Ave
- 1021 E 9th St
- 1020 E 8th St
- 1014 E 9th St
- 905 E 7th St
- 1022 E 8th St
- 310 S Osage Ave
- 1018 E 9th St
Your Personal Tour Guide
Ask me questions while you tour the home.