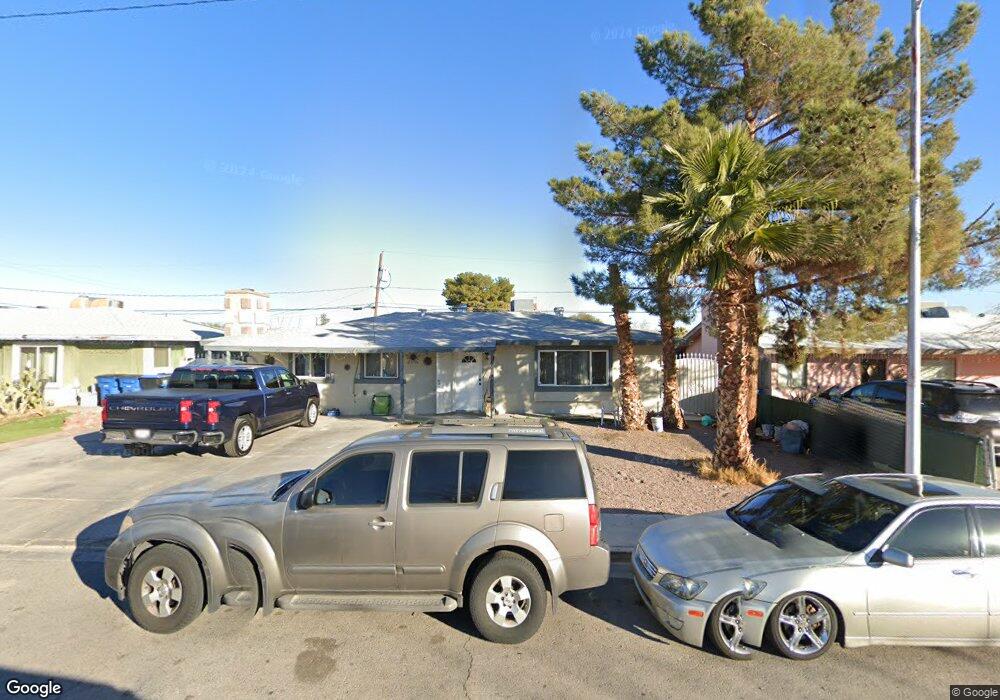
916 E Webb Ave North Las Vegas, NV 89030
Downtown North Las Vegas NeighborhoodEstimated Value: $304,498 - $361,000
3
Beds
1
Bath
1,344
Sq Ft
$249/Sq Ft
Est. Value
About This Home
This home is located at 916 E Webb Ave, North Las Vegas, NV 89030 and is currently estimated at $334,625, approximately $248 per square foot. 916 E Webb Ave is a home located in Clark County with nearby schools including C.P. Squires Elementary School, J.D. Smith Middle School, and Rancho High School.
Ownership History
Date
Name
Owned For
Owner Type
Purchase Details
Closed on
Apr 16, 2021
Sold by
Dedelgado Patricia G Ordonez
Bought by
Delgado Jose Jesus
Current Estimated Value
Purchase Details
Closed on
Sep 28, 2010
Sold by
Hsbc Bank Usa National Association
Bought by
Delgado Jose Dejesus and Delgado Patricia Ordonez
Purchase Details
Closed on
Jul 2, 2010
Sold by
Pulido Jose L and Pulido Esther
Bought by
Hsbc Bank Usa National Association
Purchase Details
Closed on
Jul 13, 1999
Sold by
Johnston Eugene and Johnston Donald Eugene
Bought by
Barkman Josephine
Home Financials for this Owner
Home Financials are based on the most recent Mortgage that was taken out on this home.
Original Mortgage
$84,205
Interest Rate
7.63%
Mortgage Type
FHA
Purchase Details
Closed on
Jun 24, 1999
Sold by
Barkman Josephine and Grady Josephine
Bought by
Pulido Jose L and Pulido Esther
Home Financials for this Owner
Home Financials are based on the most recent Mortgage that was taken out on this home.
Original Mortgage
$84,205
Interest Rate
7.63%
Mortgage Type
FHA
Create a Home Valuation Report for This Property
The Home Valuation Report is an in-depth analysis detailing your home's value as well as a comparison with similar homes in the area
Home Values in the Area
Average Home Value in this Area
Purchase History
| Date | Buyer | Sale Price | Title Company |
|---|---|---|---|
| Delgado Jose Jesus | -- | None Available | |
| Delgado Jose Dejesus | $40,000 | Chicago Title Las Vegas | |
| Hsbc Bank Usa National Association | $37,800 | Fidelity National Default S | |
| Barkman Josephine | -- | Stewart Title | |
| Pulido Jose L | $85,000 | Stewart Title |
Source: Public Records
Mortgage History
| Date | Status | Borrower | Loan Amount |
|---|---|---|---|
| Previous Owner | Pulido Jose L | $84,205 |
Source: Public Records
Tax History Compared to Growth
Tax History
| Year | Tax Paid | Tax Assessment Tax Assessment Total Assessment is a certain percentage of the fair market value that is determined by local assessors to be the total taxable value of land and additions on the property. | Land | Improvement |
|---|---|---|---|---|
| 2025 | $791 | $42,432 | $24,850 | $17,582 |
| 2024 | $733 | $42,432 | $24,850 | $17,582 |
| 2023 | $733 | $42,427 | $26,600 | $15,827 |
| 2022 | $679 | $38,298 | $24,150 | $14,148 |
| 2021 | $629 | $34,180 | $21,000 | $13,180 |
| 2020 | $581 | $31,714 | $18,900 | $12,814 |
| 2019 | $544 | $26,720 | $14,350 | $12,370 |
| 2018 | $519 | $23,111 | $11,550 | $11,561 |
| 2017 | $713 | $21,259 | $9,800 | $11,459 |
| 2016 | $488 | $18,452 | $7,350 | $11,102 |
| 2015 | $485 | $16,018 | $5,250 | $10,768 |
| 2014 | $470 | $14,761 | $4,200 | $10,561 |
Source: Public Records
Map
Nearby Homes
- 1812 Roosevelt St
- 1819 N Bruce St
- 1412 Flower Ave
- 1828 Harvard St
- 1615 Flower Ave
- 1820 Yale St
- 1826 Yale St
- 1905 Harvard St
- 2105 Stanley Ave
- 1808 Princeton St
- 1809 Brady Ave
- 1914 Harvard St
- 4 Britz Cir
- 1313 N 23rd St
- 2005 Jansen Ave
- 1829 Goldfield St
- 1705 Leslie Ave Unit 1
- 833 N Bruce St
- 828 Held Rd
- 2315 Perliter Ave
- 1000 E Webb Ave
- 912 E Webb Ave
- 917 Stanley Ave
- 1001 Stanley Ave
- 913 Stanley Ave
- 1004 E Webb Ave
- 908 E Webb Ave
- 1005 Stanley Ave
- 909 Stanley Ave
- 917 E Webb Ave
- 1001 E Webb Ave
- 1008 E Webb Ave
- 904 E Webb Ave
- 909 E Webb Ave
- 1005 E Webb Ave
- 1009 Stanley Ave
- 905 Stanley Ave
- 1012 E Webb Ave
- 900 E Webb Ave