916 Grove St Salinas, CA 93901
South Salinas NeighborhoodEstimated Value: $833,479 - $930,000
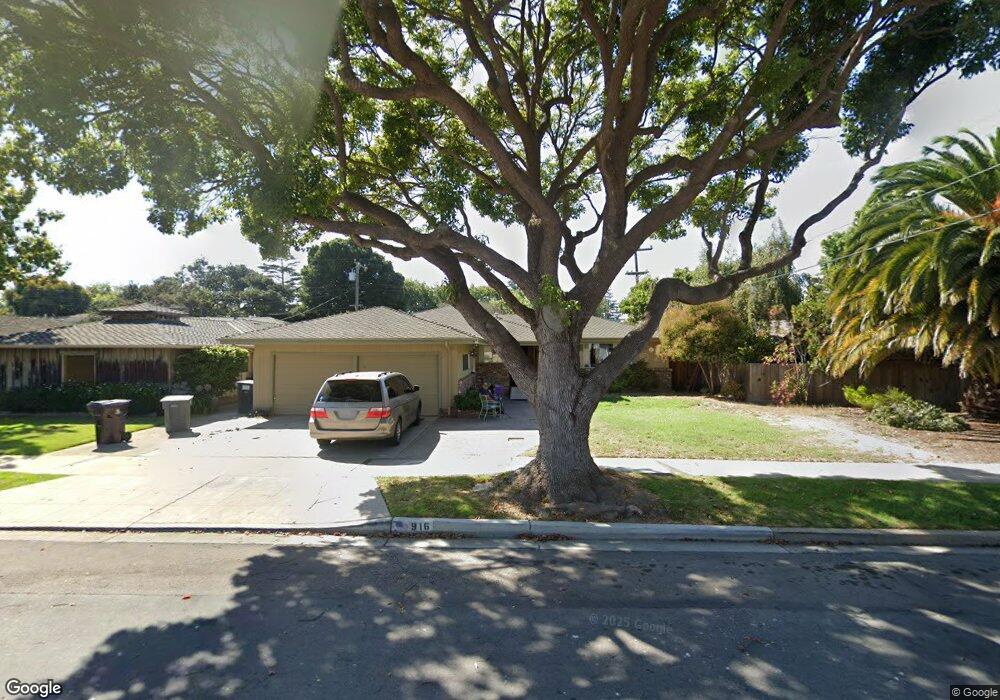
About This Home
This home is located at 916 Grove St, Salinas, CA 93901 and is currently estimated at $862,620, approximately $449 per square foot. 916 Grove St is a home located in Monterey County with nearby schools including Lincoln Elementary School, Monterey Park Elementary School, and Mission Park Elementary School.
Ownership History
We collect this data history from publicly available records. To have your information removed, we recommend requesting removal directly through your county’s website.
Purchase Details
Purchase Details
Home Financials for this Owner
Home Financials are based on the most recent Mortgage that was taken out on this home.Purchase Details
Home Values in the Area
Average Home Value in this Area
Purchase History
We collect this data history from publicly available records. To have your information removed, we recommend requesting removal directly through your county’s website.
| Date | Buyer | Sale Price | Title Company |
|---|---|---|---|
| -- | None Listed On Document | ||
| -- | Old Republic Title Company | ||
| -- | First American Title Ins Co |
Mortgage History
We collect this data history from publicly available records. To have your information removed, we recommend requesting removal directly through your county’s website.
| Date | Status | Borrower | Loan Amount |
|---|---|---|---|
| Previous Owner | $780,000 |
Tax History
We collect this data history from publicly available records. To have your information removed, we recommend requesting removal directly through your county’s website.
| Year | Tax Paid | Tax Assessment Tax Assessment Total Assessment is a certain percentage of the fair market value that is determined by local assessors to be the total taxable value of land and additions on the property. | Land | Improvement |
|---|---|---|---|---|
| 2025 | $3,209 | $217,818 | $52,054 | $165,764 |
| 2024 | $3,209 | $213,548 | $51,034 | $162,514 |
| 2023 | $3,025 | $209,362 | $50,034 | $159,328 |
| 2022 | $2,813 | $205,257 | $49,053 | $156,204 |
| 2021 | $2,628 | $201,234 | $48,092 | $153,142 |
| 2020 | $2,571 | $199,171 | $47,599 | $151,572 |
| 2019 | $2,512 | $195,266 | $46,666 | $148,600 |
| 2018 | $2,415 | $191,438 | $45,751 | $145,687 |
| 2017 | $2,070 | $187,685 | $44,854 | $142,831 |
| 2016 | $2,429 | $184,006 | $43,975 | $140,031 |
| 2015 | $2,433 | $181,243 | $43,315 | $137,928 |
| 2014 | $2,279 | $177,694 | $42,467 | $135,227 |
Map
- 1102 San Marcos Dr
- 239 Oak St
- 222 Oak St
- 632 San Tomas Way
- 219 Pine St
- 202 Pine St
- 1123 San Angelo Dr
- 22 San Juan Dr
- 219 Harvest St
- 137 Maple St
- 54 Katherine Ave
- 40 Oak St
- 50 Katherine Ave
- 1266 San Marcos Dr
- 1268 La Mirada Dr
- 251 La Mesa Dr
- 69 Geil St
- 1051 Padre Dr Unit 7
- 1067 Padre Dr Unit 1
- 1067 Padre Dr Unit 2
Ask me questions while you tour the home.