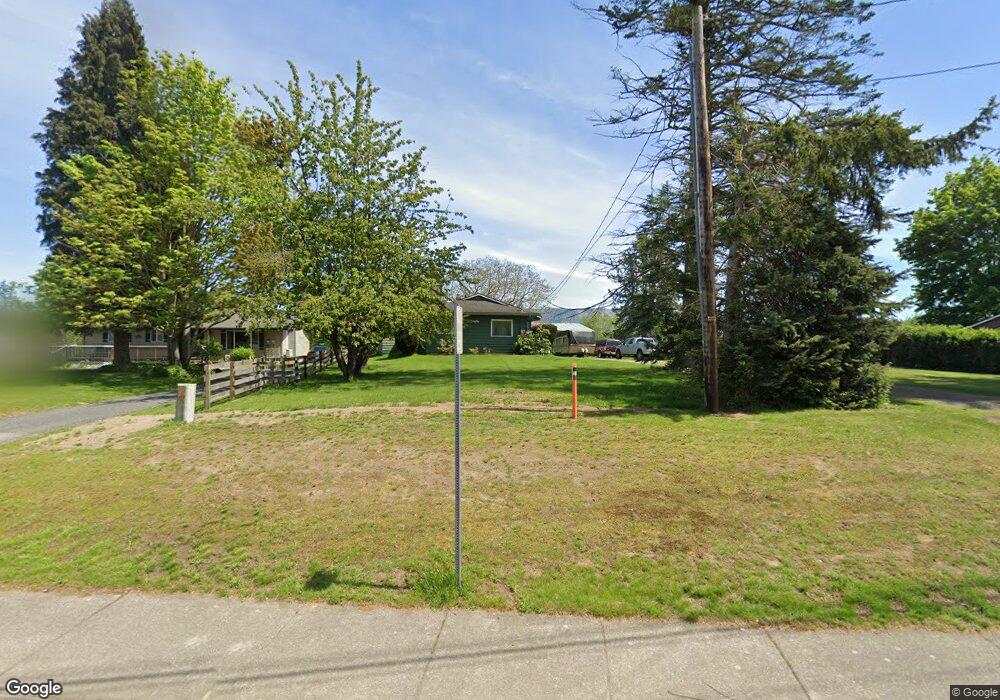
916 Mission Rd Everson, WA 98247
Estimated Value: $385,000 - $507,000
3
Beds
1
Bath
1,341
Sq Ft
$340/Sq Ft
Est. Value
About This Home
This home is located at 916 Mission Rd, Everson, WA 98247 and is currently estimated at $456,350, approximately $340 per square foot. 916 Mission Rd is a home located in Whatcom County with nearby schools including Everson Elementary School, Nooksack Elementary School, and Sumas Elementary School.
Ownership History
Date
Name
Owned For
Owner Type
Purchase Details
Closed on
Jul 29, 2005
Sold by
Cicogni Peachy Villanueva
Bought by
Cicogni Mark L
Current Estimated Value
Home Financials for this Owner
Home Financials are based on the most recent Mortgage that was taken out on this home.
Original Mortgage
$124,000
Outstanding Balance
$63,073
Interest Rate
5.56%
Mortgage Type
Fannie Mae Freddie Mac
Estimated Equity
$393,277
Purchase Details
Closed on
Sep 20, 2001
Sold by
Vezzetti Patricia and Hansey Patricia L
Bought by
Petersen Stephen L and Petersen Karyan R
Home Financials for this Owner
Home Financials are based on the most recent Mortgage that was taken out on this home.
Original Mortgage
$88,400
Interest Rate
6.99%
Create a Home Valuation Report for This Property
The Home Valuation Report is an in-depth analysis detailing your home's value as well as a comparison with similar homes in the area
Home Values in the Area
Average Home Value in this Area
Purchase History
| Date | Buyer | Sale Price | Title Company |
|---|---|---|---|
| Cicogni Mark L | -- | -- | |
| Cicogni Mark L | $155,280 | Stewart Title Company | |
| Petersen Stephen L | $110,500 | Chicago Title Insurance |
Source: Public Records
Mortgage History
| Date | Status | Borrower | Loan Amount |
|---|---|---|---|
| Open | Cicogni Mark L | $124,000 | |
| Previous Owner | Petersen Stephen L | $88,400 |
Source: Public Records
Tax History
| Year | Tax Paid | Tax Assessment Tax Assessment Total Assessment is a certain percentage of the fair market value that is determined by local assessors to be the total taxable value of land and additions on the property. | Land | Improvement |
|---|---|---|---|---|
| 2025 | $3,869 | $426,673 | $244,530 | $182,143 |
| 2024 | $3,481 | $411,700 | $234,000 | $177,700 |
| 2023 | $3,481 | $379,814 | $154,962 | $224,852 |
| 2022 | $3,189 | $342,181 | $139,608 | $202,573 |
| 2021 | $2,952 | $282,798 | $115,380 | $167,418 |
| 2020 | $2,837 | $229,922 | $93,807 | $136,115 |
| 2019 | $2,413 | $229,922 | $93,807 | $136,115 |
| 2018 | $2,647 | $220,591 | $90,000 | $130,591 |
| 2017 | $2,373 | $182,333 | $75,400 | $106,933 |
| 2016 | $2,271 | $168,243 | $69,550 | $98,693 |
| 2015 | $1,931 | $161,562 | $67,080 | $94,482 |
| 2014 | -- | $156,552 | $65,000 | $91,552 |
| 2013 | -- | $156,552 | $65,000 | $91,552 |
Source: Public Records
Map
Nearby Homes
- 616 Strandell St
- 800 Cedar Dr
- 809 Pine Crest Dr
- 1203 Red Tail Ct
- 1005 Night Hawk Way
- 1302 Night Hawk Way
- 107 River St
- 0 Walnut Grove Ct
- 408 W 3rd St
- 416 W 3rd St
- 108 Baker St Unit 1-4
- 207 E Main St
- 416 W 4th St
- 409 W 4th St
- 2495 River Rock Dr
- 702 N Washington St
- 3037 Massey Rd
- 107 Thendara Park Dr Unit C
- 109 W 2nd St
- 7554 Nooksack Rd
- 115 Mission Rd
- 912 Mission Rd
- 1004 Mission Rd
- 1008 Mission Rd
- 1012 Mission Rd
- 908 Mission Rd
- 904 Mission Rd
- 675 Robinson St
- 107 Mission Rd
- 1020 Mission Rd
- 217 Mission Rd
- 0 E Mission Rd Unit 29154704
- 1024 Mission Rd
- 2 Robinson St
- 4 Mission Rd
- 402 Arrowhead Ln
- 605 Robinson St
- 1028 Mission Rd
- 404 Arrowhead Ln
- 607 Robinson St
Your Personal Tour Guide
Ask me questions while you tour the home.