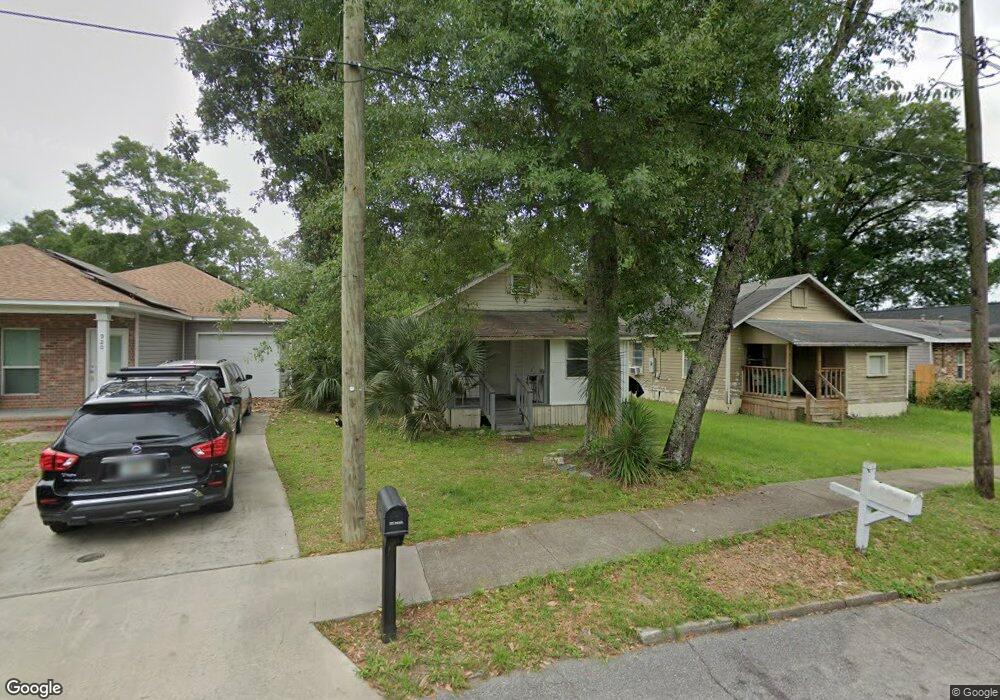
916 N L St Pensacola, FL 32501
Estimated Value: $81,106 - $248,000
--
Bed
1
Bath
713
Sq Ft
$188/Sq Ft
Est. Value
About This Home
This home is located at 916 N L St, Pensacola, FL 32501 and is currently estimated at $133,777, approximately $187 per square foot. 916 N L St is a home located in Escambia County with nearby schools including C.A. Weis Elementary School, Warrington Middle School, and Pensacola High School.
Ownership History
Date
Name
Owned For
Owner Type
Purchase Details
Closed on
Apr 1, 2015
Sold by
Hsbc Bank Usa National Association
Bought by
Community Enterprise Investments Inc
Current Estimated Value
Purchase Details
Closed on
Aug 7, 2007
Sold by
Bell Flora L and Sheppard Flora
Bought by
Bell Flora L and Bell Victor J
Purchase Details
Closed on
Mar 4, 1998
Sold by
Sheppard Flora Louise and Sheppard Flora
Bought by
Sheppard Flora Louise and Sheppard Flora
Home Financials for this Owner
Home Financials are based on the most recent Mortgage that was taken out on this home.
Original Mortgage
$22,400
Interest Rate
7.07%
Create a Home Valuation Report for This Property
The Home Valuation Report is an in-depth analysis detailing your home's value as well as a comparison with similar homes in the area
Home Values in the Area
Average Home Value in this Area
Purchase History
| Date | Buyer | Sale Price | Title Company |
|---|---|---|---|
| Community Enterprise Investments Inc | -- | Servicelink Llc | |
| Bell Flora L | $7,500 | None Available | |
| Sheppard Flora Louise | $4,300 | -- |
Source: Public Records
Mortgage History
| Date | Status | Borrower | Loan Amount |
|---|---|---|---|
| Previous Owner | Sheppard Flora Louise | $22,400 |
Source: Public Records
Tax History Compared to Growth
Tax History
| Year | Tax Paid | Tax Assessment Tax Assessment Total Assessment is a certain percentage of the fair market value that is determined by local assessors to be the total taxable value of land and additions on the property. | Land | Improvement |
|---|---|---|---|---|
| 2024 | $880 | $61,603 | $11,095 | $50,508 |
| 2023 | $880 | $46,247 | $0 | $0 |
| 2022 | $812 | $53,756 | $11,095 | $42,661 |
| 2021 | $704 | $38,916 | $0 | $0 |
| 2020 | $630 | $34,747 | $0 | $0 |
| 2019 | $600 | $32,786 | $0 | $0 |
| 2018 | $573 | $30,735 | $0 | $0 |
| 2017 | $543 | $28,528 | $0 | $0 |
| 2016 | $561 | $29,094 | $0 | $0 |
| 2015 | $544 | $27,799 | $0 | $0 |
| 2014 | $30 | $25,012 | $0 | $0 |
Source: Public Records
Map
Nearby Homes