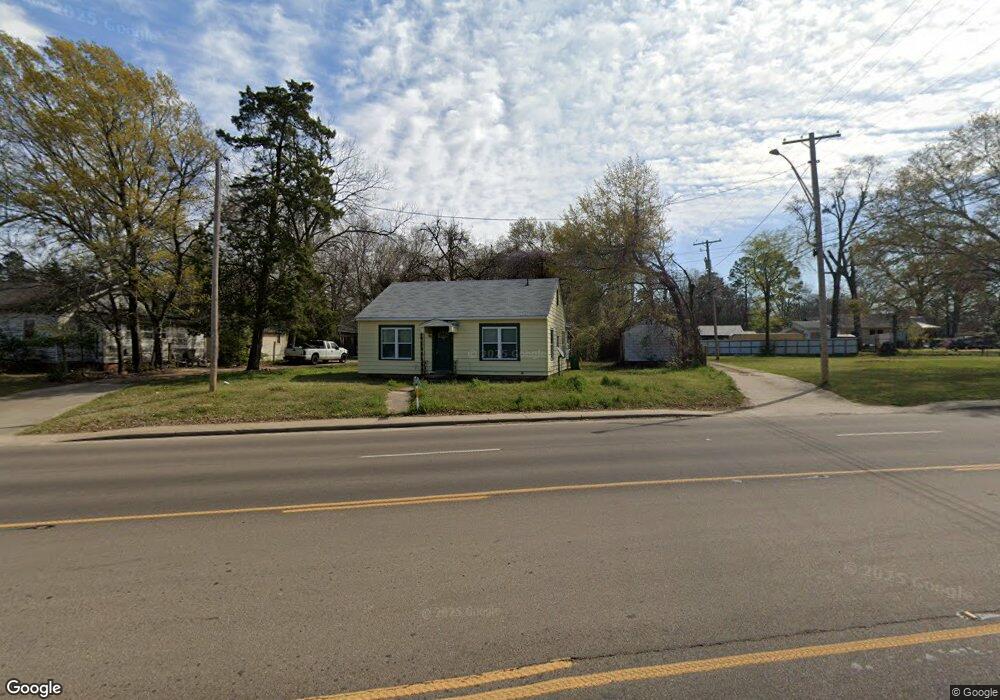
916 N Lake Dr Texarkana, TX 75501
Estimated Value: $48,000 - $85,000
--
Bed
--
Bath
1,150
Sq Ft
$54/Sq Ft
Est. Value
About This Home
This home is located at 916 N Lake Dr, Texarkana, TX 75501 and is currently estimated at $61,596, approximately $53 per square foot. 916 N Lake Dr is a home located in Bowie County with nearby schools including Theron Jones Early Literacy Center, Westlawn Elementary School, and Texas Middle School.
Ownership History
Date
Name
Owned For
Owner Type
Purchase Details
Closed on
Dec 19, 2024
Sold by
Llybf Properties Llc
Bought by
Cng Real Investments Llc
Current Estimated Value
Home Financials for this Owner
Home Financials are based on the most recent Mortgage that was taken out on this home.
Original Mortgage
$42,700
Outstanding Balance
$42,364
Interest Rate
6.79%
Mortgage Type
New Conventional
Estimated Equity
$19,232
Purchase Details
Closed on
Sep 1, 2009
Sold by
Franklin John and Franklin Francine
Bought by
Llybf Properties Llc
Create a Home Valuation Report for This Property
The Home Valuation Report is an in-depth analysis detailing your home's value as well as a comparison with similar homes in the area
Home Values in the Area
Average Home Value in this Area
Purchase History
| Date | Buyer | Sale Price | Title Company |
|---|---|---|---|
| Cng Real Investments Llc | -- | Twin City Title | |
| Cng Real Investments Llc | -- | Twin City Title | |
| Llybf Properties Llc | $7,200 | None Available |
Source: Public Records
Mortgage History
| Date | Status | Borrower | Loan Amount |
|---|---|---|---|
| Open | Cng Real Investments Llc | $42,700 | |
| Closed | Cng Real Investments Llc | $42,700 |
Source: Public Records
Tax History Compared to Growth
Tax History
| Year | Tax Paid | Tax Assessment Tax Assessment Total Assessment is a certain percentage of the fair market value that is determined by local assessors to be the total taxable value of land and additions on the property. | Land | Improvement |
|---|---|---|---|---|
| 2025 | $544 | $24,377 | $1,500 | $22,877 |
| 2024 | $544 | $22,968 | $1,000 | $21,968 |
| 2023 | $506 | $21,357 | $1,000 | $20,357 |
| 2022 | $458 | $19,197 | $1,000 | $18,197 |
| 2021 | $461 | $18,028 | $1,500 | $16,528 |
| 2020 | $409 | $15,897 | $1,500 | $14,397 |
| 2019 | $428 | $16,034 | $1,500 | $14,534 |
| 2018 | $417 | $15,616 | $1,500 | $14,116 |
| 2017 | $408 | $15,345 | $1,500 | $13,845 |
| 2016 | $389 | $14,639 | $1,500 | $13,139 |
| 2015 | $445 | $14,639 | $1,500 | $13,139 |
| 2014 | $445 | $17,186 | $1,500 | $15,686 |
Source: Public Records
Map
Nearby Homes