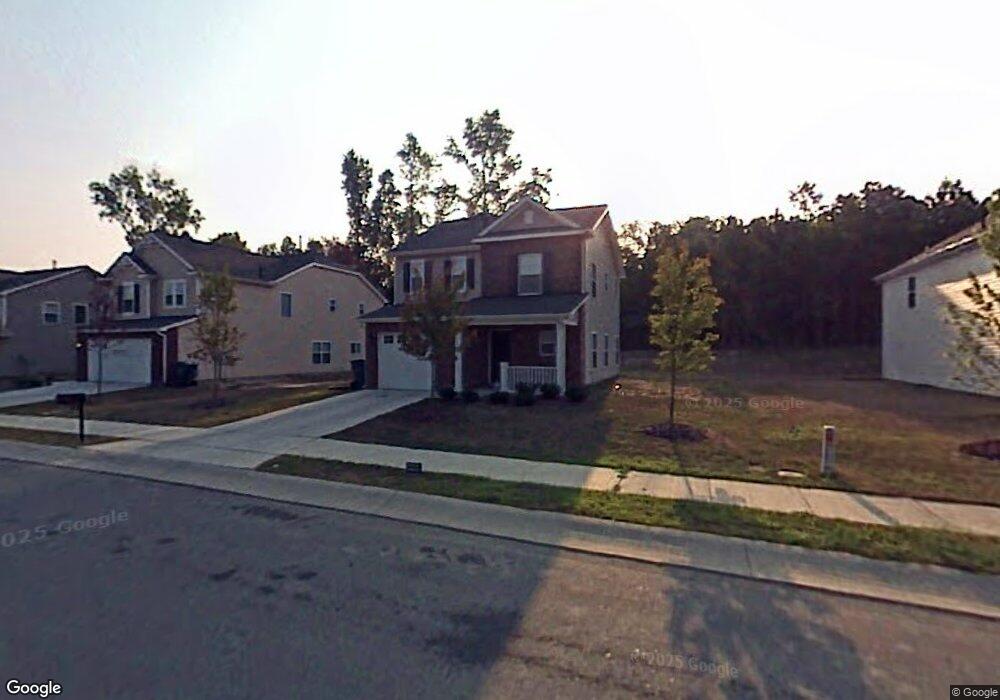
916 Obsidian Way Durham, NC 27703
Eastern Durham NeighborhoodEstimated Value: $263,000 - $333,000
3
Beds
3
Baths
1,423
Sq Ft
$221/Sq Ft
Est. Value
About This Home
This home is located at 916 Obsidian Way, Durham, NC 27703 and is currently estimated at $313,805, approximately $220 per square foot. 916 Obsidian Way is a home located in Durham County with nearby schools including Glenn Elementary, John W Neal Middle School, and Southern School of Energy & Sustainability.
Ownership History
Date
Name
Owned For
Owner Type
Purchase Details
Closed on
May 10, 2019
Sold by
Mcgill Larrisha and Youngblood Gregory J
Bought by
Bishop Zachary
Current Estimated Value
Home Financials for this Owner
Home Financials are based on the most recent Mortgage that was taken out on this home.
Original Mortgage
$174,510
Outstanding Balance
$153,430
Interest Rate
4.2%
Mortgage Type
New Conventional
Estimated Equity
$160,375
Purchase Details
Closed on
Aug 29, 2005
Sold by
Kb Home Raleigh Durham Llc
Bought by
Mcgill Larrisha
Home Financials for this Owner
Home Financials are based on the most recent Mortgage that was taken out on this home.
Original Mortgage
$112,400
Interest Rate
6.5%
Mortgage Type
New Conventional
Purchase Details
Closed on
May 23, 2005
Sold by
Durham Land Associates Llc
Bought by
Kb Home Raleigh Durham Llc
Create a Home Valuation Report for This Property
The Home Valuation Report is an in-depth analysis detailing your home's value as well as a comparison with similar homes in the area
Home Values in the Area
Average Home Value in this Area
Purchase History
| Date | Buyer | Sale Price | Title Company |
|---|---|---|---|
| Bishop Zachary | $194,000 | None Available | |
| Mcgill Larrisha | $137,000 | -- | |
| Kb Home Raleigh Durham Llc | $180,000 | -- |
Source: Public Records
Mortgage History
| Date | Status | Borrower | Loan Amount |
|---|---|---|---|
| Open | Bishop Zachary | $174,510 | |
| Previous Owner | Mcgill Larrisha | $112,400 | |
| Previous Owner | Mcgill Larrisha | $28,100 |
Source: Public Records
Tax History Compared to Growth
Tax History
| Year | Tax Paid | Tax Assessment Tax Assessment Total Assessment is a certain percentage of the fair market value that is determined by local assessors to be the total taxable value of land and additions on the property. | Land | Improvement |
|---|---|---|---|---|
| 2025 | $3,443 | $347,305 | $109,800 | $237,505 |
| 2024 | $2,261 | $162,071 | $30,400 | $131,671 |
| 2023 | $2,123 | $162,071 | $30,400 | $131,671 |
| 2022 | $2,074 | $162,071 | $30,400 | $131,671 |
| 2021 | $2,065 | $162,071 | $30,400 | $131,671 |
| 2020 | $2,016 | $162,071 | $30,400 | $131,671 |
| 2019 | $2,016 | $162,071 | $30,400 | $131,671 |
| 2018 | $1,882 | $138,713 | $24,320 | $114,393 |
| 2017 | $1,868 | $138,713 | $24,320 | $114,393 |
| 2016 | $1,805 | $138,713 | $24,320 | $114,393 |
| 2015 | $2,005 | $144,812 | $32,365 | $112,447 |
| 2014 | $2,005 | $144,812 | $32,365 | $112,447 |
Source: Public Records
Map
Nearby Homes
- 912 Obsidian Way
- 1011 Homecoming Way
- 3615 Freeman Rd
- 3602 Turquoise Dr
- 9 Petersburg Place
- 10 Petersburg Place
- 1103 Kindness Ln
- 1114 Kindness Ln
- 1143 Sweet Cream Ct
- 1060 Gentle Reed Dr
- 521 Quartz Dr
- 4 Hertford Place
- 6 Fircrest Ct
- 59 Enesco Cir
- 612 Chivalry Dr
- 3801 Tyne Dr
- 903 Outlaw Ave Unit Homesite 21
- 2018 Cross Bones Blvd
- 2018 Cross Bones Blvd Unit 28
- 507 Chivalry Dr
- 918 Obsidian Way
- 914 Obsidian Way
- 920 Obsidian Way
- 915 Obsidian Way
- 917 Obsidian Way
- 922 Obsidian Way
- 910 Obsidian Way
- 913 Obsidian Way
- 919 Obsidian Way
- 3520 Freeman Rd
- 911 Obsidian Way
- 924 Obsidian Way
- 921 Obsidian Way
- 908 Obsidian Way
- 8 Wetherburn Place
- 10 Wetherburn Place
- 909 Obsidian Way
- 6 Wetherburn Place
- 12 Wetherburn Place
- 923 Obsidian Way