
Seller's Agent in 2024
Malcolm Payne
Payne Realty
(470) 985-4004
2 in this area
147 Total Sales

Estimated Value: $526,000 - $642,000
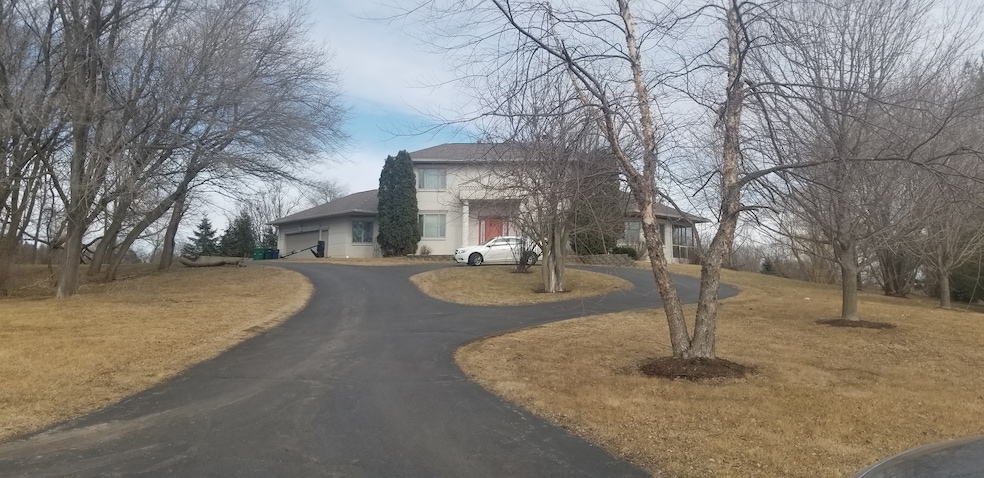
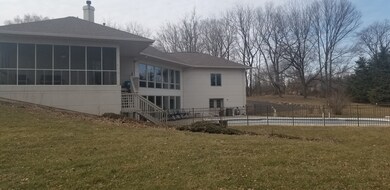
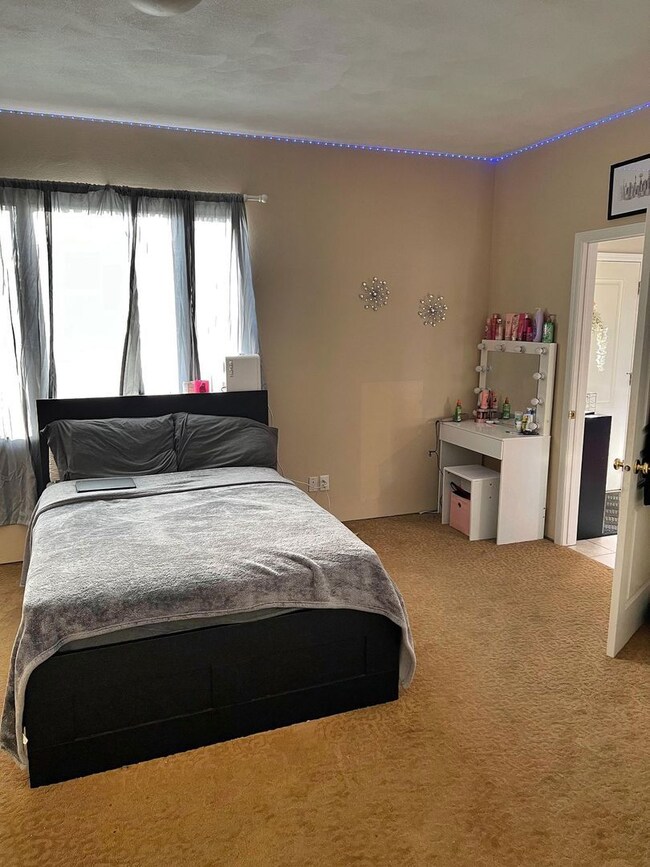
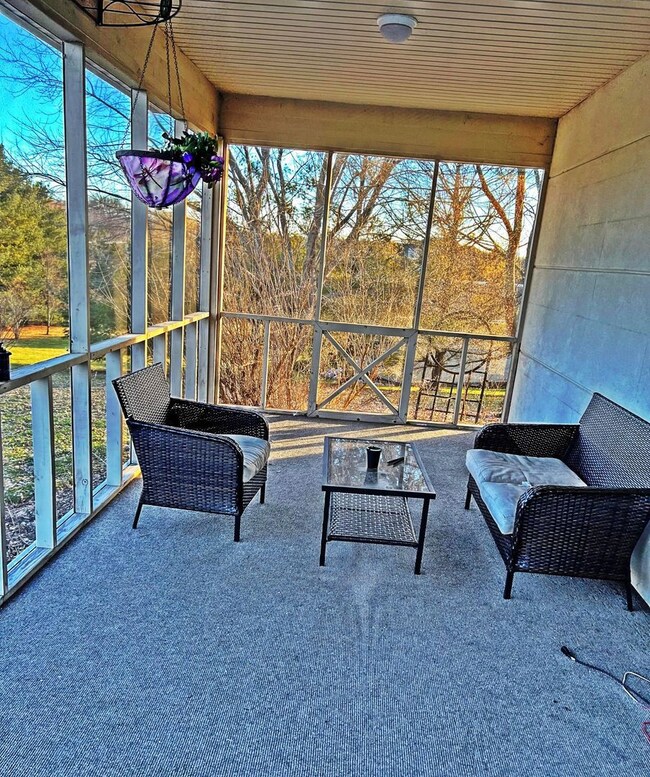
This home is located at 916 Olson Spring Close, Belvidere, IL 61008 since 23 March 2022 and is currently estimated at $582,675, approximately $137 per square foot. This property was built in 2000. 916 Olson Spring Close is a home located in Boone County with nearby schools including Seth Whitman Elementary School, Belvidere Central Middle School, and Belvidere North High School.
| Date | Buyer | Sale Price | Title Company |
|---|---|---|---|
| Hernandez Ernesto B | $500,000 | Title Underwriters Agency | |
| Chaires Alex | $390,000 | Title Underwriters Agency | |
| Santorini Dee B | -- | -- |
| Date | Status | Borrower | Loan Amount |
|---|---|---|---|
| Open | Hernandez Ernesto B | $400,000 | |
| Previous Owner | Chaires Alex | $345,186 |
| Date | Event | Price | List to Sale | Price per Sq Ft | Prior Sale |
|---|---|---|---|---|---|
| 04/17/2024 04/17/24 | Sold | $500,000 | 0.0% | $118 / Sq Ft | |
| 04/17/2024 04/17/24 | Sold | $500,000 | 0.0% | $118 / Sq Ft | View Prior Sale |
| 03/16/2024 03/16/24 | Pending | -- | -- | -- | |
| 12/26/2023 12/26/23 | For Sale | $500,000 | 0.0% | $118 / Sq Ft | |
| 12/26/2023 12/26/23 | For Sale | $500,000 | 0.0% | $118 / Sq Ft | |
| 12/01/2023 12/01/23 | Pending | -- | -- | -- | |
| 12/01/2023 12/01/23 | Pending | -- | -- | -- | |
| 10/08/2023 10/08/23 | For Sale | $500,000 | 0.0% | $118 / Sq Ft | |
| 10/08/2023 10/08/23 | For Sale | $500,000 | 0.0% | $118 / Sq Ft | |
| 10/08/2023 10/08/23 | Off Market | $500,000 | -- | -- | |
| 10/07/2023 10/07/23 | Off Market | $500,000 | -- | -- | |
| 12/08/2022 12/08/22 | Price Changed | $500,000 | 0.0% | $118 / Sq Ft | |
| 12/08/2022 12/08/22 | For Sale | $500,000 | 0.0% | $118 / Sq Ft | |
| 12/08/2022 12/08/22 | Price Changed | $500,000 | 0.0% | $118 / Sq Ft | |
| 12/08/2022 12/08/22 | For Sale | $500,000 | 0.0% | $118 / Sq Ft | |
| 12/04/2022 12/04/22 | Off Market | $500,000 | -- | -- | |
| 12/03/2022 12/03/22 | Off Market | $500,000 | -- | -- | |
| 10/05/2022 10/05/22 | Price Changed | $475,000 | 0.0% | $112 / Sq Ft | |
| 10/05/2022 10/05/22 | Price Changed | $475,000 | -5.0% | $112 / Sq Ft | |
| 09/03/2022 09/03/22 | Price Changed | $500,000 | 0.0% | $118 / Sq Ft | |
| 09/03/2022 09/03/22 | Price Changed | $500,000 | -4.8% | $118 / Sq Ft | |
| 06/05/2022 06/05/22 | Price Changed | $525,000 | 0.0% | $124 / Sq Ft | |
| 06/05/2022 06/05/22 | For Sale | $525,000 | 0.0% | $124 / Sq Ft | |
| 06/05/2022 06/05/22 | Price Changed | $525,000 | 0.0% | $124 / Sq Ft | |
| 06/05/2022 06/05/22 | For Sale | $525,000 | +5.0% | $124 / Sq Ft | |
| 06/04/2022 06/04/22 | Off Market | $500,000 | -- | -- | |
| 06/03/2022 06/03/22 | Off Market | $500,000 | -- | -- | |
| 03/29/2022 03/29/22 | Price Changed | $575,000 | 0.0% | $136 / Sq Ft | |
| 03/29/2022 03/29/22 | Price Changed | $575,000 | -8.0% | $136 / Sq Ft | |
| 03/23/2022 03/23/22 | For Sale | $625,000 | 0.0% | $148 / Sq Ft | |
| 03/03/2022 03/03/22 | For Sale | $625,000 | +60.3% | $148 / Sq Ft | |
| 01/31/2020 01/31/20 | Sold | $390,000 | -2.5% | $147 / Sq Ft | View Prior Sale |
| 12/27/2019 12/27/19 | Pending | -- | -- | -- | |
| 10/24/2019 10/24/19 | For Sale | $399,900 | 0.0% | $151 / Sq Ft | |
| 10/24/2019 10/24/19 | Price Changed | $399,900 | +2.5% | $151 / Sq Ft | |
| 10/03/2019 10/03/19 | Off Market | $390,000 | -- | -- | |
| 07/12/2019 07/12/19 | Price Changed | $429,900 | -1.1% | $162 / Sq Ft | |
| 06/19/2019 06/19/19 | Price Changed | $434,900 | -1.1% | $164 / Sq Ft | |
| 05/23/2019 05/23/19 | Price Changed | $439,900 | -2.2% | $166 / Sq Ft | |
| 03/22/2019 03/22/19 | For Sale | $449,900 | -- | $170 / Sq Ft |
| Year | Tax Paid | Tax Assessment Tax Assessment Total Assessment is a certain percentage of the fair market value that is determined by local assessors to be the total taxable value of land and additions on the property. | Land | Improvement |
|---|---|---|---|---|
| 2024 | $12,694 | $165,121 | $25,758 | $139,363 |
| 2023 | $12,694 | $159,235 | $25,758 | $133,477 |
| 2022 | $12,102 | $148,446 | $25,758 | $122,688 |
| 2021 | $10,513 | $129,675 | $25,758 | $103,917 |
| 2020 | $11,869 | $131,769 | $25,758 | $106,011 |
| 2019 | $12,188 | $138,920 | $25,758 | $113,162 |
| 2018 | $12,099 | $439,414 | $333,000 | $106,414 |
| 2017 | $11,536 | $132,597 | $26,183 | $106,414 |
| 2016 | $11,847 | $130,445 | $26,016 | $104,429 |
| 2015 | $5,283 | $113,526 | $25,758 | $87,768 |
| 2014 | $1,832 | $110,547 | $25,758 | $84,789 |
Seller's Agent in 2024
Malcolm Payne
Payne Realty
(470) 985-4004
2 in this area
147 Total Sales
Buyer's Agent in 2024
Roberto Morales-Corona
Coldwell Banker Realty
(847) 809-2050
5 in this area
52 Total Sales
A
Buyer's Agent in 2024
AGENT RECIPROCAL
RAAR
Seller's Agent in 2020
Frank Gambino
Gambino Realtors
(815) 637-0113
1 in this area
69 Total Sales
Source: Midwest Real Estate Data (MRED)
MLS Number: 11354972
APN: 05-07-226-004
Disclaimer: Certain information contained herein is derived from information provided by parties other than Homes.com. All information provided is deemed reliable, but is not guaranteed to be accurate and should be independently verified.
![]() Based on information submitted to the MLS GRID. All data is obtained from various sources and may not have been verified by broker or MLS GRID. Supplied Open House Information is subject to change without notice. All information should be independently reviewed and verified for accuracy. Properties may or may not be listed by the office/agent presenting the information. Some IDX listings have been excluded from this website.
Based on information submitted to the MLS GRID. All data is obtained from various sources and may not have been verified by broker or MLS GRID. Supplied Open House Information is subject to change without notice. All information should be independently reviewed and verified for accuracy. Properties may or may not be listed by the office/agent presenting the information. Some IDX listings have been excluded from this website.
The Digital Millennium Copyright Act of 1998, 17 U.S.C. § 512 (the “DMCA”) provides recourse for copyright owners who believe that material appearing on the Internet infringes their rights under U.S. copyright law. If you believe in good faith that any content or material made available in connection with our website or services infringes your copyright, you (or your agent) may send us a notice requesting that the content or material be removed, or access to it blocked.
Notices must be sent in writing by email to DMCAnotice@MLSGrid.com.
The DMCA requires that your notice of alleged copyright infringement include the following information:
(1) description of the copyrighted work that is the subject of claimed infringement;
(2) description of the alleged infringing content and information sufficient to permit us to locate the content;
(3) contact information for you, including your address, telephone number and email address;
(4) a statement by you that you have a good faith belief that the content in the manner complained of is not authorized by the copyright owner, or its agent, or by the operation of any law;
(5) a statement by you, signed under penalty of perjury, that the information in the notification is accurate and that you have the authority to enforce the copyrights that are claimed to be infringed; and
(6) a physical or electronic signature of the copyright owner or a person authorized to act on the copyright owner’s behalf. Failure to include all of the above information may result in the delay of the processing of your complaint.
Ask me questions while you tour the home.