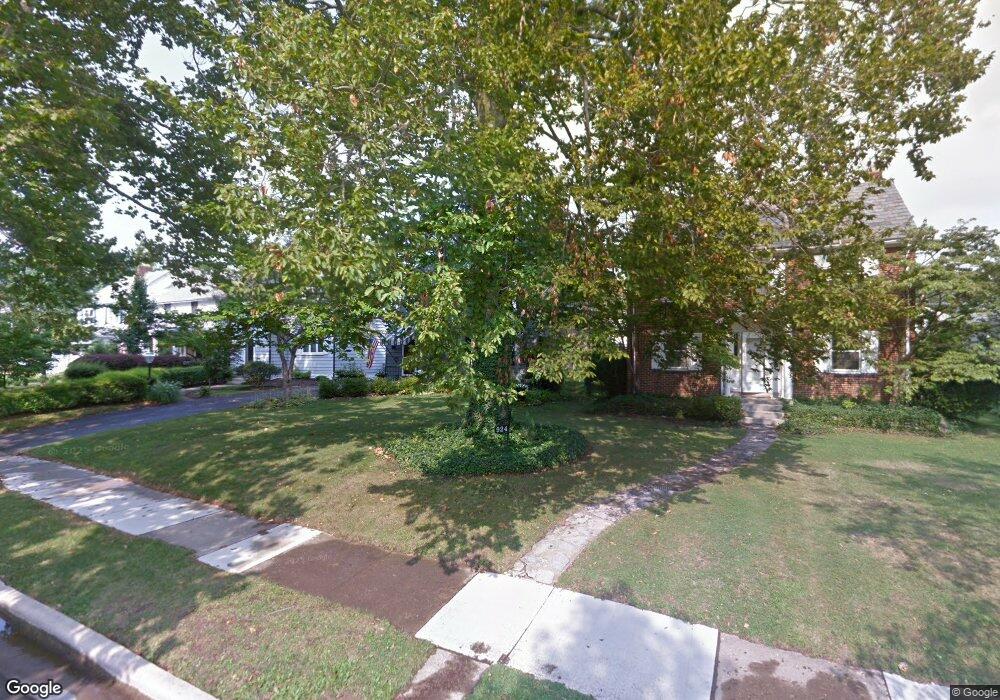
916 S Cassingham Rd Columbus, OH 43209
Estimated Value: $386,000 - $524,000
3
Beds
3
Baths
1,862
Sq Ft
$251/Sq Ft
Est. Value
About This Home
This home is located at 916 S Cassingham Rd, Columbus, OH 43209 and is currently estimated at $467,223, approximately $250 per square foot. 916 S Cassingham Rd is a home located in Franklin County with nearby schools including Montrose Elementary School, Bexley Middle School, and Bexley High School.
Ownership History
Date
Name
Owned For
Owner Type
Purchase Details
Closed on
Jul 20, 1999
Sold by
Meyer Jeffrey D and Meyer Debra H
Bought by
Mackay Peter D
Current Estimated Value
Home Financials for this Owner
Home Financials are based on the most recent Mortgage that was taken out on this home.
Original Mortgage
$176,100
Outstanding Balance
$45,508
Interest Rate
7.54%
Mortgage Type
VA
Estimated Equity
$421,715
Purchase Details
Closed on
Oct 19, 1993
Purchase Details
Closed on
Sep 1, 1984
Create a Home Valuation Report for This Property
The Home Valuation Report is an in-depth analysis detailing your home's value as well as a comparison with similar homes in the area
Home Values in the Area
Average Home Value in this Area
Purchase History
| Date | Buyer | Sale Price | Title Company |
|---|---|---|---|
| Mackay Peter D | $171,000 | Hummel Title Agency Inc | |
| -- | $118,000 | -- | |
| -- | $68,000 | -- |
Source: Public Records
Mortgage History
| Date | Status | Borrower | Loan Amount |
|---|---|---|---|
| Open | Mackay Peter D | $176,100 |
Source: Public Records
Tax History
| Year | Tax Paid | Tax Assessment Tax Assessment Total Assessment is a certain percentage of the fair market value that is determined by local assessors to be the total taxable value of land and additions on the property. | Land | Improvement |
|---|---|---|---|---|
| 2025 | $7,077 | $127,440 | $42,630 | $84,810 |
| 2024 | $7,077 | $127,440 | $42,630 | $84,810 |
| 2023 | $6,363 | $127,435 | $42,630 | $84,805 |
| 2022 | $6,501 | $104,580 | $22,540 | $82,040 |
| 2021 | $6,507 | $104,580 | $22,540 | $82,040 |
| 2020 | $6,449 | $104,580 | $22,540 | $82,040 |
| 2019 | $6,175 | $88,100 | $18,800 | $69,300 |
| 2018 | $5,062 | $88,100 | $18,800 | $69,300 |
| 2017 | $5,236 | $88,100 | $18,800 | $69,300 |
| 2016 | $4,744 | $72,940 | $17,850 | $55,090 |
| 2015 | $4,758 | $72,940 | $17,850 | $55,090 |
| 2014 | $4,785 | $72,940 | $17,850 | $55,090 |
| 2013 | $2,369 | $69,475 | $17,010 | $52,465 |
Source: Public Records
Map
Nearby Homes
- 890 S Cassingham Rd
- 905 Vernon Rd
- 2393-2395 Dover Rd
- 878 Grandon Ave
- 661 S Cassingham Rd
- 789 Chelsea Ave
- 712 Chelsea Ave
- 2424 Sherwood Rd
- 2604 Sherwood Rd
- 2433 Brookwood Rd
- 2820 Eastminster Rd
- 2676 Tudor Rd
- 2425 Bryden Rd
- 2947 E Mound St
- 2981 Templeton Rd
- 2417 Fair Ave
- 1423 Cottingham Ct E
- 1057-1059 S James Rd
- 669 Brookside Dr
- 1048 S James Rd
- 910 S Cassingham Rd
- 924 S Cassingham Rd
- 908 S Cassingham Rd
- 930 S Cassingham Rd
- 902 S Cassingham Rd
- 2419 S Havenwood Dr
- 925 Montrose Ave
- 919 Montrose Ave
- 931 Montrose Ave
- 915 Montrose Ave
- 896 S Cassingham Rd
- 935 Montrose Ave
- 2415 Havenwood Dr S
- 2415 S Havenwood Dr
- 944 S Cassingham Rd
- 909 Montrose Ave
- 2411 S Havenwood Dr
- 901 Montrose Ave
- 951 Montrose Ave
- 950 S Cassingham Rd
Your Personal Tour Guide
Ask me questions while you tour the home.